- NZDUSD Price Analysis: Bulls remain hopeful above 0.5785-90 support confluence
Notícias do Mercado
NZDUSD Price Analysis: Bulls remain hopeful above 0.5785-90 support confluence
- NZDUSD pares the biggest daily gains in 11 years.
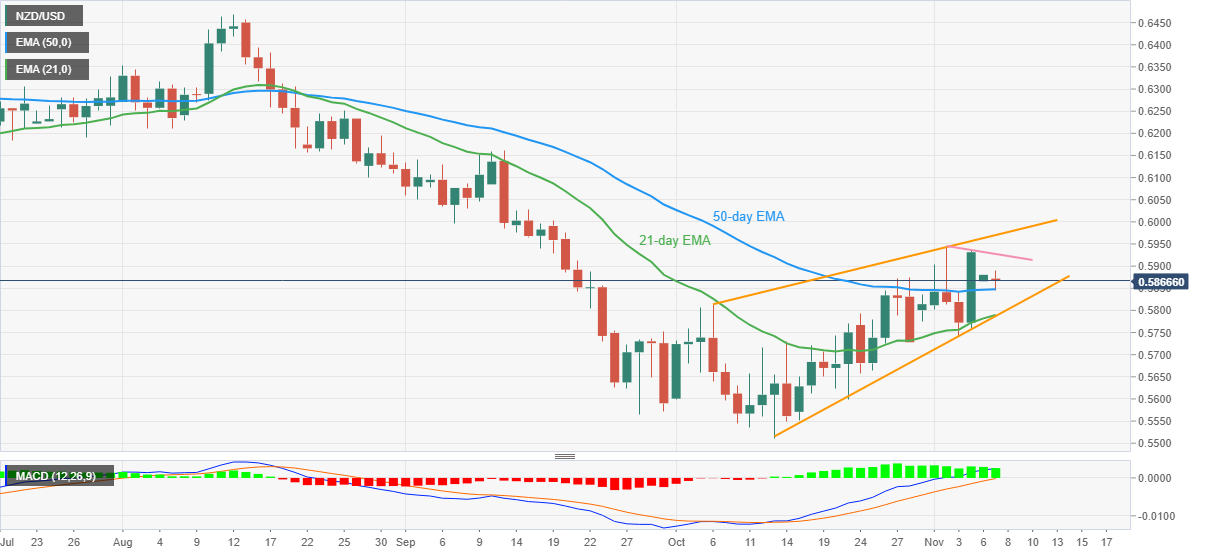
- 50-day EMA restricts immediate declines inside one-month-old rising wedge.
- Convergence of 21-day EMA, wedge’s support appears a tough nut to crack for the bears.
- Buyers need validation from the immediate resistance line to retake control.
NZDUSD bears attack 50-day EMA support around 0.5850 during the early hours of Monday, after posting the biggest daily jump since October 2011 the previous day. In doing so, the Kiwi pair stays inside a monthly rising wedge bearish chart pattern.
Given the retreat in the bullish MACD signals, the quote may pare the latest gains and can break the immediate EMA support near 0.5850.
However, the 21-day EMA and lower line of the stated wedge constitute a tough nut to crack for the NZDUSD bears around 0.5790-85.
Should the pair sellers manage to conquer the 0.5785 support confluence, the odds of witnessing a fresh yearly low, currently around 0.5510, can’t be ruled out.
Alternatively, recovery moves will need a clear break of a downward-slopping resistance line from the last Wednesday, near 0.5930 by the press time.
Following that, the stated wedge’s upper line could test the NZDUSD bulls around 0.5980. Also acting as an upside filter is the 0.6000 psychological magnet.
In a case where the Kiwi pair remains firmer past 0.6000, the odds of witnessing a run-up towards September’s peak of 0.6162 appear brighter.
NZDUSD: Daily chart
Trend: Limited upside expected