- GBP/JPY Price Analysis: Struggles at 169.00 and plunges below 168.00 amid an upbeat mood
Notícias do Mercado
GBP/JPY Price Analysis: Struggles at 169.00 and plunges below 168.00 amid an upbeat mood
- The inverted head-and-shoulders chart pattern on the GBP/JPY daily chart remains intact.
- From the daily chart perspective, the GBP/JPY is upward biased.
- GBP/JPY Price Analysis: After breaking below 168.00, it exacerbated a fall towards 167.00 and beyond.
The British Pound (GBP) is losing ground against the Japanese Yen (JPY) on Thursday, even though sentiment improved after the US Federal Reserve (Fed) agreed to slow the pace of rate increases. Hence, Asian and European stocks rallied, but the JPY had the upper hand in the FX space. At the time of writing, the GBP/JPY is trading at 167.71 after hitting a daily high of 168.29.
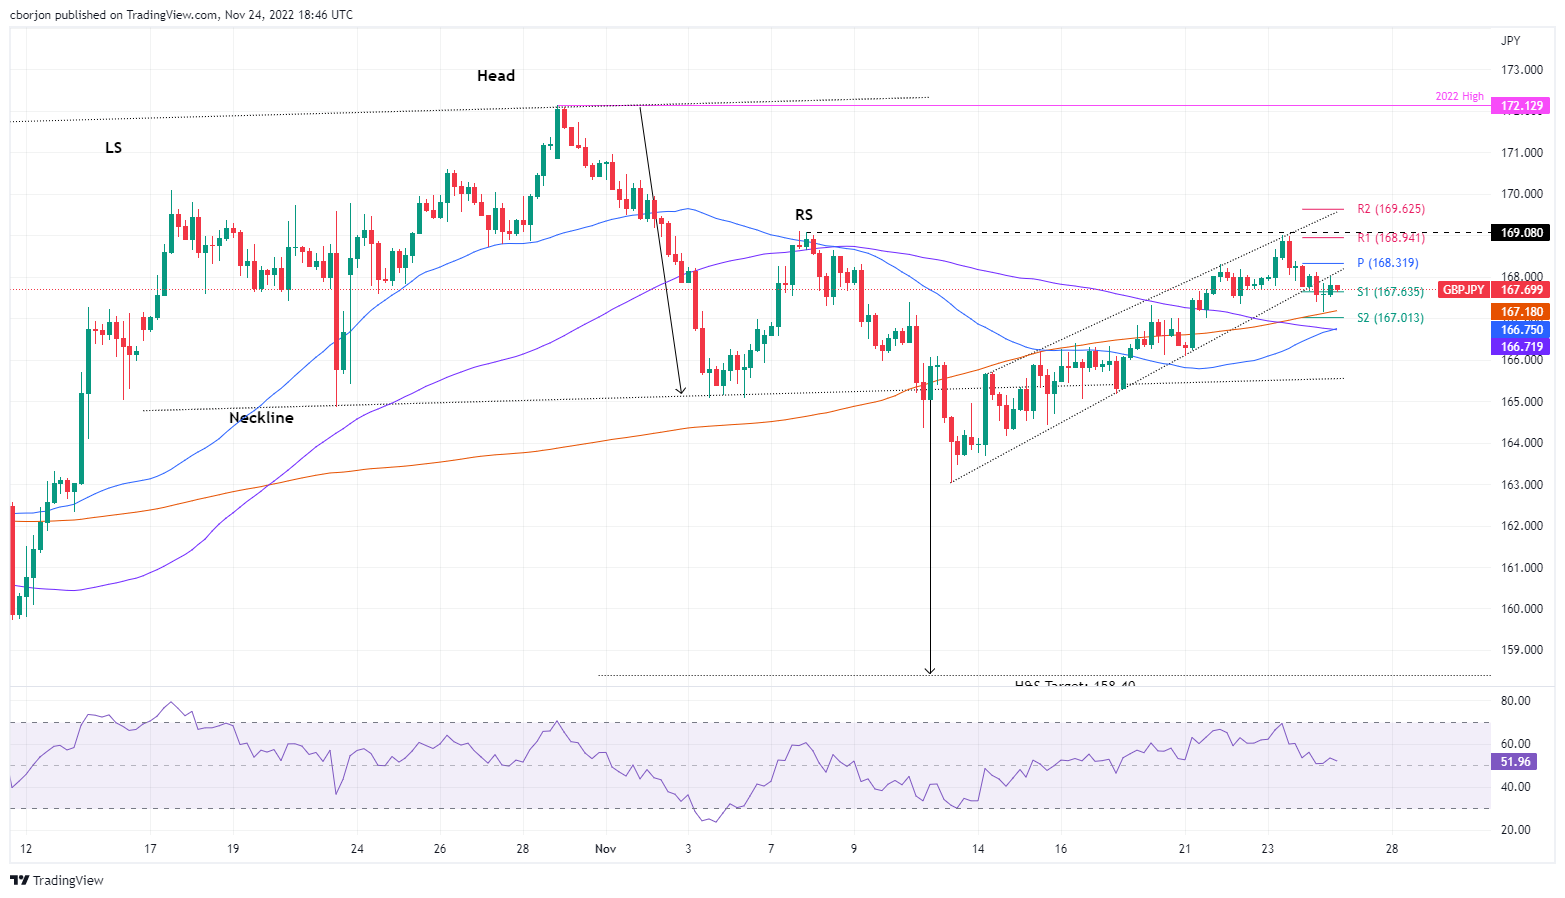
GBP/JPY Price Analysis: Technical outlook
The GBP/JPY daily chart illustrates the pair as upward biased, even though a head-and-shoulders chart pattern emerged and remains intact. On Wednesday, the cross climbed nearby the pattern’s right shoulder, but sellers leaning below 169.00 sent the GBP/JPY tumbling towards 168.00 and beyond. Of note, the Relative Strength Index (RSI) remains above the 50-midline, but buyers are losing momentum as the slope turns down.
Short term, the GBP/JPY 4-hour chart shows the cross broke below the bottom-trendline of a rising wedge, signaling that sellers are moving in. However, unless the GBP/JPY tumbles below the 200-Exponential Moving Average (EMA) at 167.18 and the S1 daily pivot at 167.00, risks will remain skewed to the upside. On the other hand, if the GBP/JPY reclaims 168.00, the inverted head-and-shoulders chart pattern could be invalidated if the cross pierces 169.00.
GBP/JPY Key Technical Levels