- EUR/GBP Price Analysis: Inverse H&S highlights 0.8660 resistance
Notícias do Mercado
EUR/GBP Price Analysis: Inverse H&S highlights 0.8660 resistance
- EUR/GBP teases confirmation of a bullish chart pattern, reverses the previous day’s losses.
- 200-SMA adds to the upside filters, 0.8570 restricts short-term downside.
- RSI, MACD suggests further upside momentum toward the monthly high.
EUR/GBP picks up bids to reverse the previous day’s losses around 0.8650 during the initial European session on Wednesday.
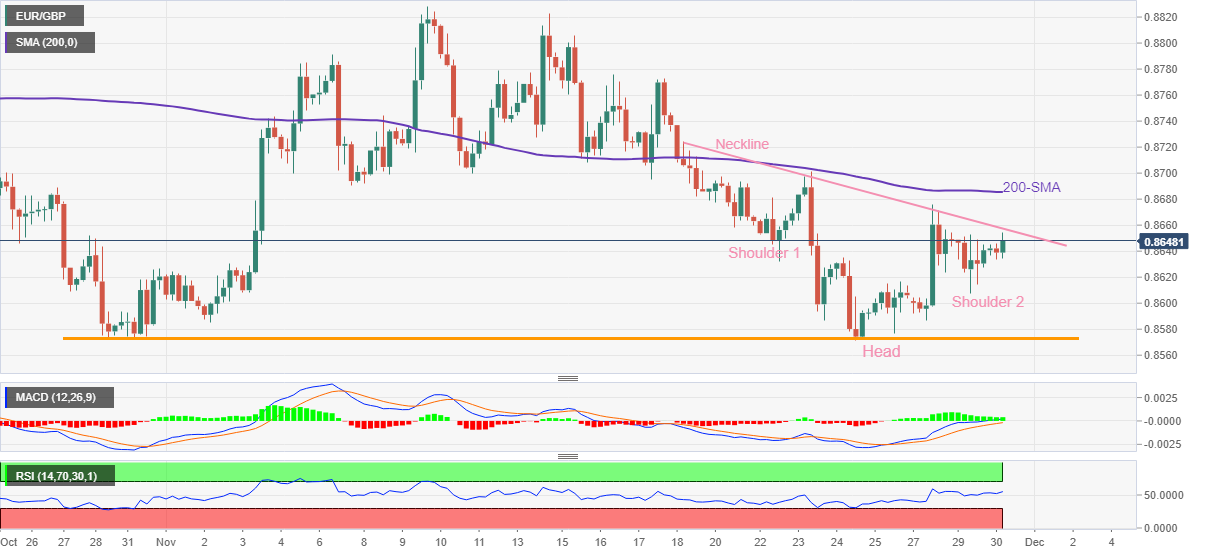
In doing so, the cross-currency pair extends Friday’s rebound from the lowest levels since September while poking the neckline of a short-term inverse head-and-shoulders (H&S) bullish chart formation.
It’s worth observing that the upward-sloping RSI (14), not overbought, joins the bullish MACD signals to suggest a clear break of the 0.8660 hurdle.
Following that, the 200-SMA level of 0.8685 could probe the advances toward the theoretical target surrounding the monthly high near 0.8830.
On the contrary, pullback moves remain elusive unless staying beyond the latest swing low of 0.8607.
Even so, the lows marked during late October and in the last week, around 0.8570, appear a tough nut to crack for the EUR/GBP bears.
In a case where the pair remains weak past 0.8570, September’s bottom near 0.8565 may act as a buffer as sellers aim for the August 19 peak of 0.8511.
Overall, EUR/GBP is likely to remain firmer and can extend the latest recovery as the inverse H&S formation joins upbeat oscillators, namely the RSI and MACD.
EUR/GBP: Four-hour chart

Trend: Further upside expected