- NZD/USD Price Analysis: Stays defensive above 0.6300, pokes monthly support line
Notícias do Mercado
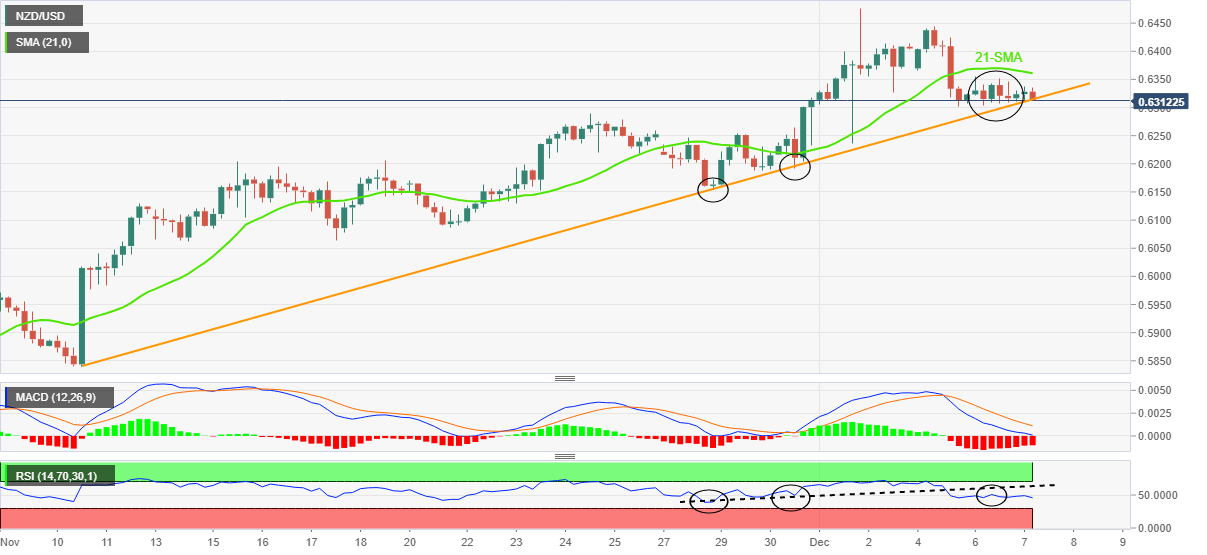
NZD/USD Price Analysis: Stays defensive above 0.6300, pokes monthly support line
- NZD/USD remains sidelined as sellers attack short-term key support line.
- Bearish MACD signals, RSI divergence keeps sellers hopeful.
- 21-SMA guards immediate recovery, 0.6470-75 region is the key hurdle to the north.
NZD/USD treads waters around 0.6320-30 as bears flirt with the short-term key support line during early Wednesday. Even so, the Kiwi pair’s failure to cross the 21-SMA and bearish MACD signals hint at the quote’s further downside.
Also keeping sellers hopeful is the bearish RSI divergence on the chart. The oscillator-price divergence could be witnessed when the NZD/USD prints higher lows but the RSI, placed at 14, fails to print the commensurate bottoms, which in turn suggests the lack of momentum strength even if the prices remain firmer.
As a result, the bearish move could quickly be materialized at the first chance.
That said, an upward-sloping support line from November 10, near 0.6315, gains major attention as a downside break of the same might work as a trigger for the NZD/USD south-run.
In that case, lows marked on November 28 and 17, respectively near 0.6155 and 0.6065, could lure the bears before highlighting the previous monthly low of 0.5740.
On the flip side, a clear break of the 21-SMA level surrounding 0.6360 appears necessary to convince NZD/USD buyers.
Even so, multiple hurdles surrounding 0.6470-75, comprising the highs marked in August and December, appear a tough nut to crack for the bulls before retaking control.
NZD/USD: Four-hour chart
Trend: Further weakness expected