- USD/CAD Price Analysis: Bulls and bears battle in key territory
Notícias do Mercado
USD/CAD Price Analysis: Bulls and bears battle in key territory
- USD/CAD bears are lurking with prospects of a deeper correction.
- Bulls remain in play while above the triangle.
test As per the prior analysis, USD/CAD Price Analysis: Bulls and bears battle it out at key structure, the bears did indeed move into prior highs near 1.3580, an area that has started to offer support. A break of 1.3700 opens the prospects of a run on liquidity towards 1.3800/25 stops in a continuation of the short squeeze.
USD/CAD prior analysis
It was stated that USD/CAD is in an uptrend with eyes on a break of 1.4000. However, the following charts illustrated a number of key structures to take into consideration:
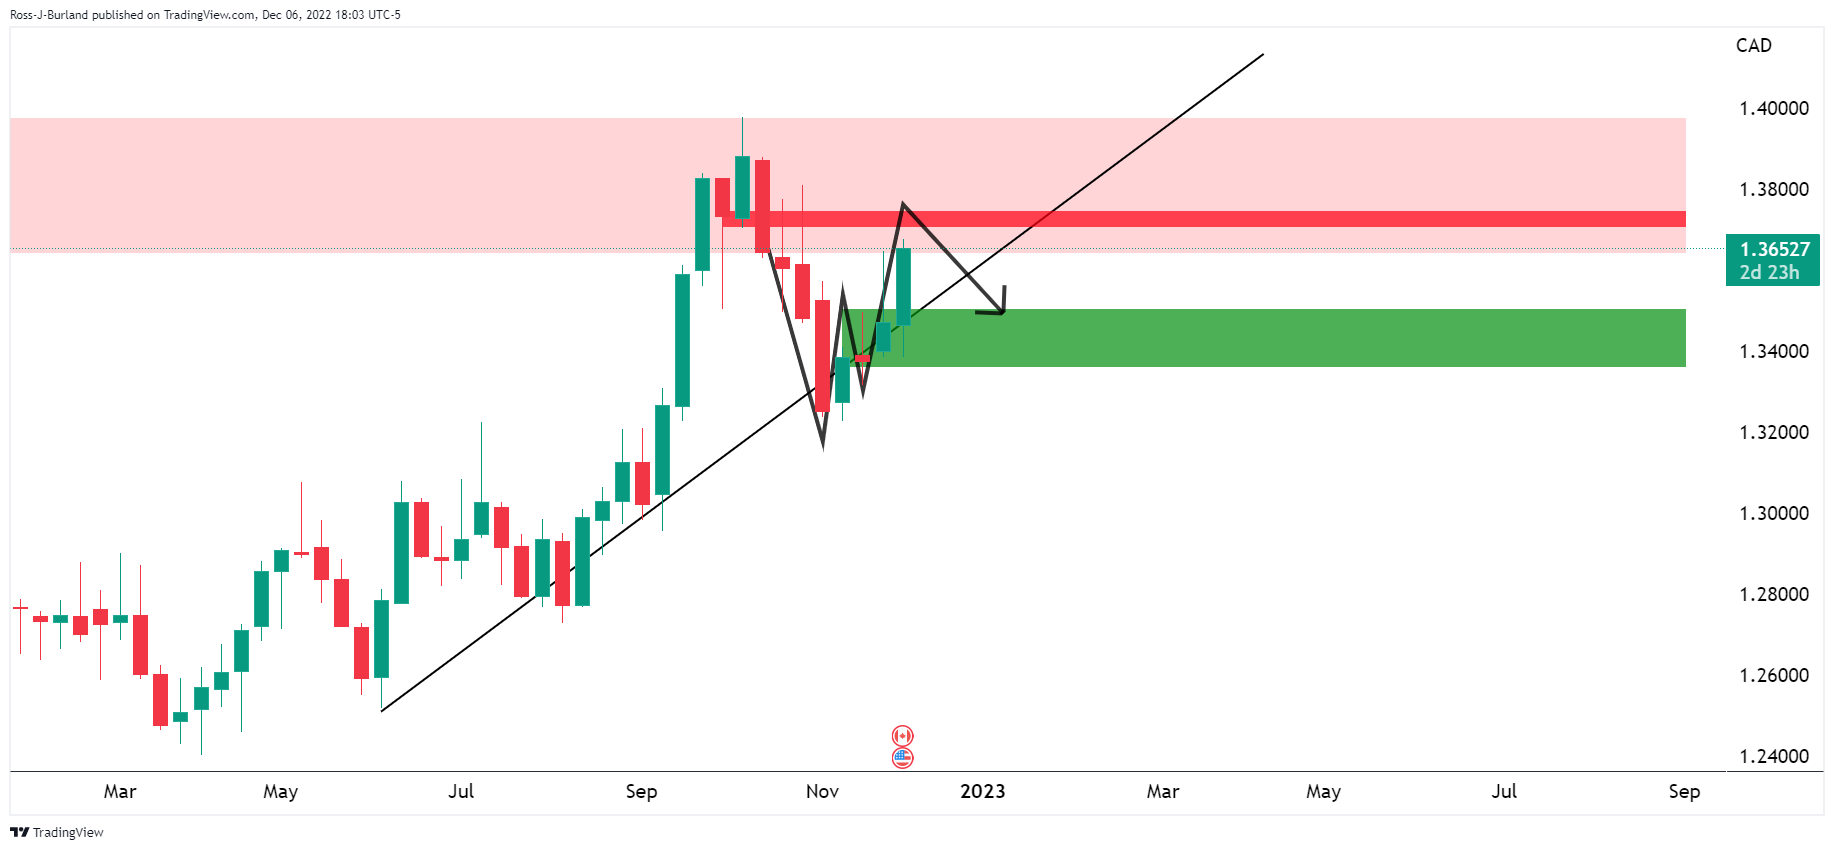
There are conflicting patterns on the weekly chart, wit the W-formation, on the chart above, and an M pattern on the chart below.
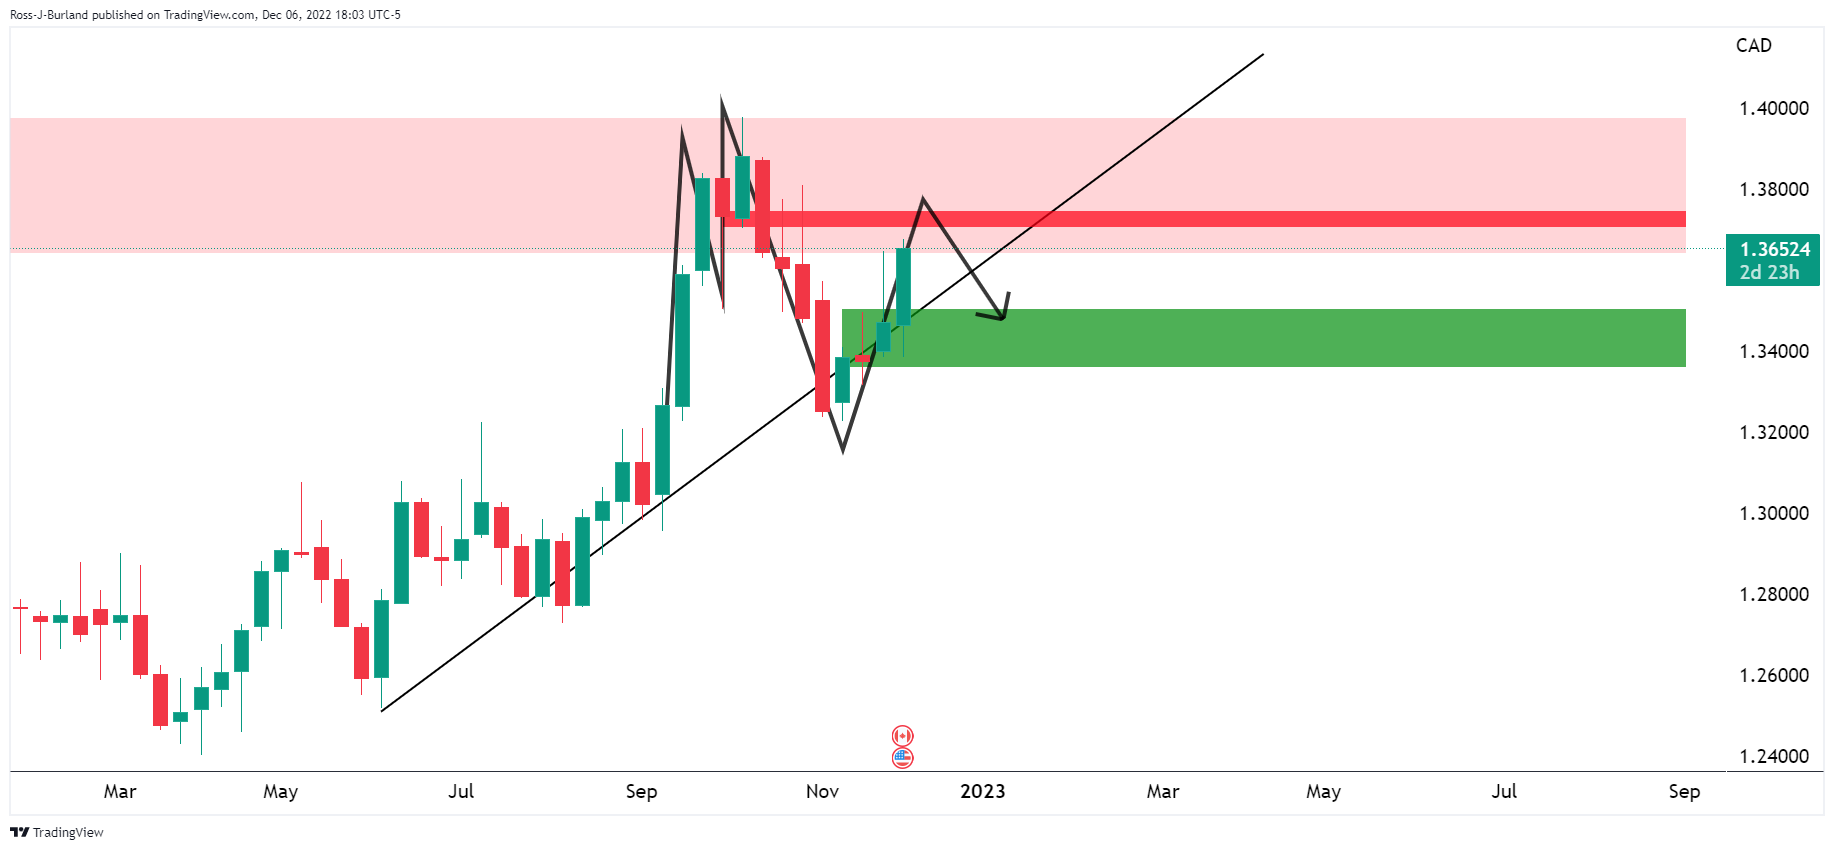
Given the price had rallied towards the neckline of the M-formation, the path of least resistance was expected to be to the downside as the following daily chart showed:
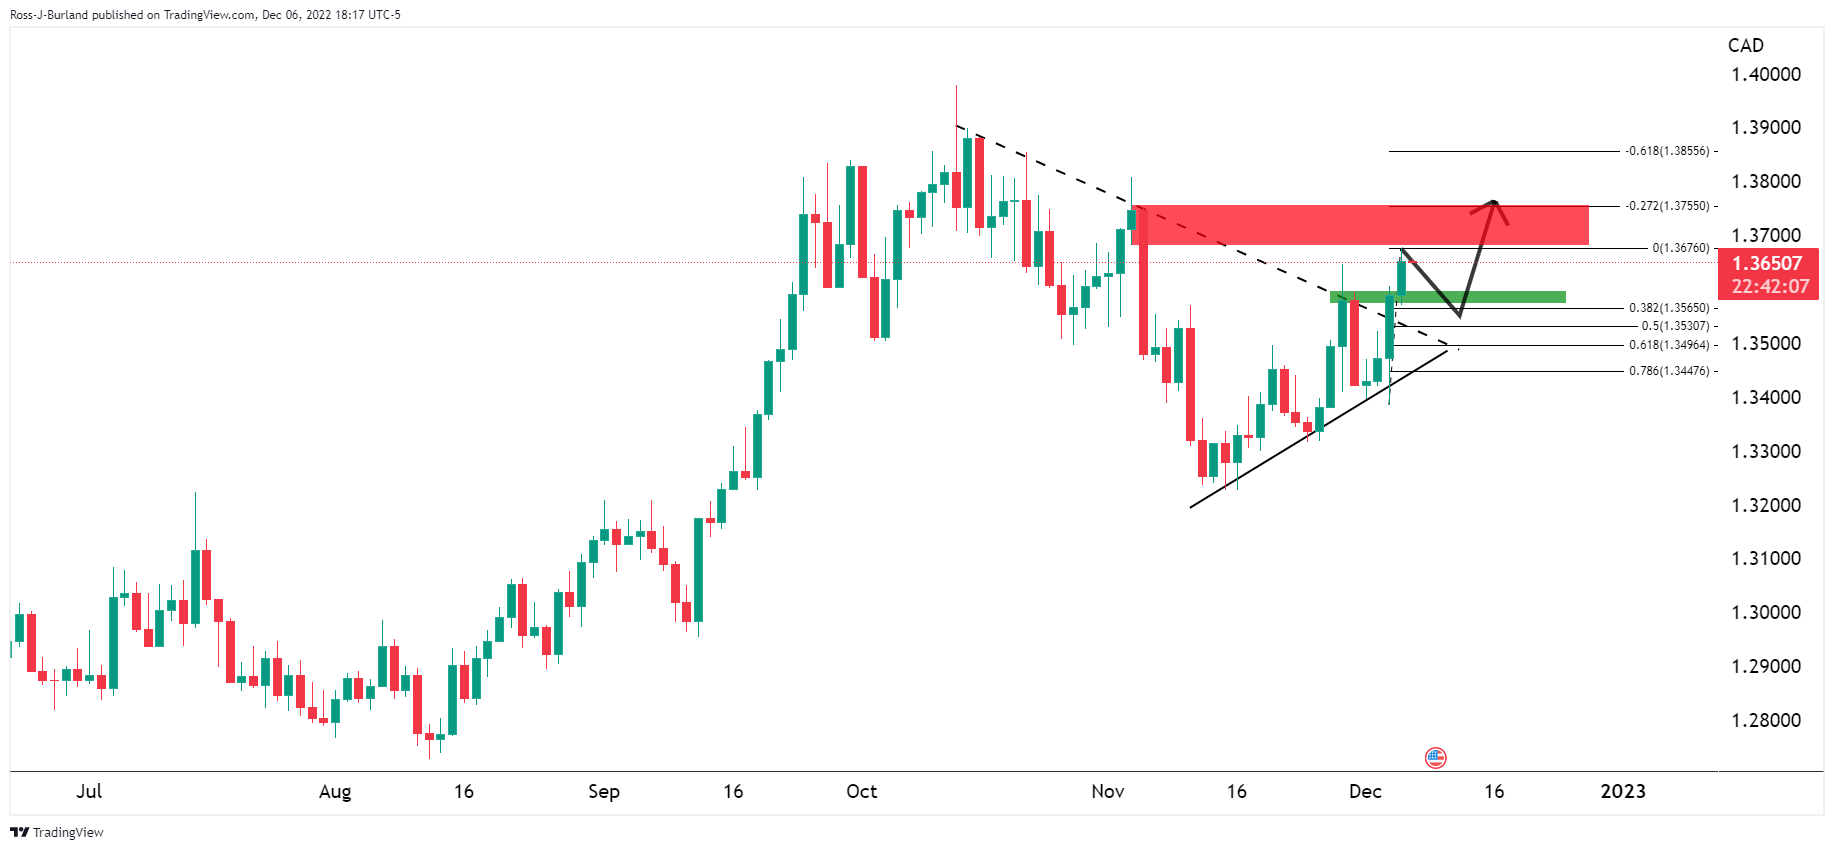
USD/CAD broke out of the triangle meeting the 1.3650s and a correction was anticipated into prior highs near 1.3580.
USD/CAD update, daily & H4 chart
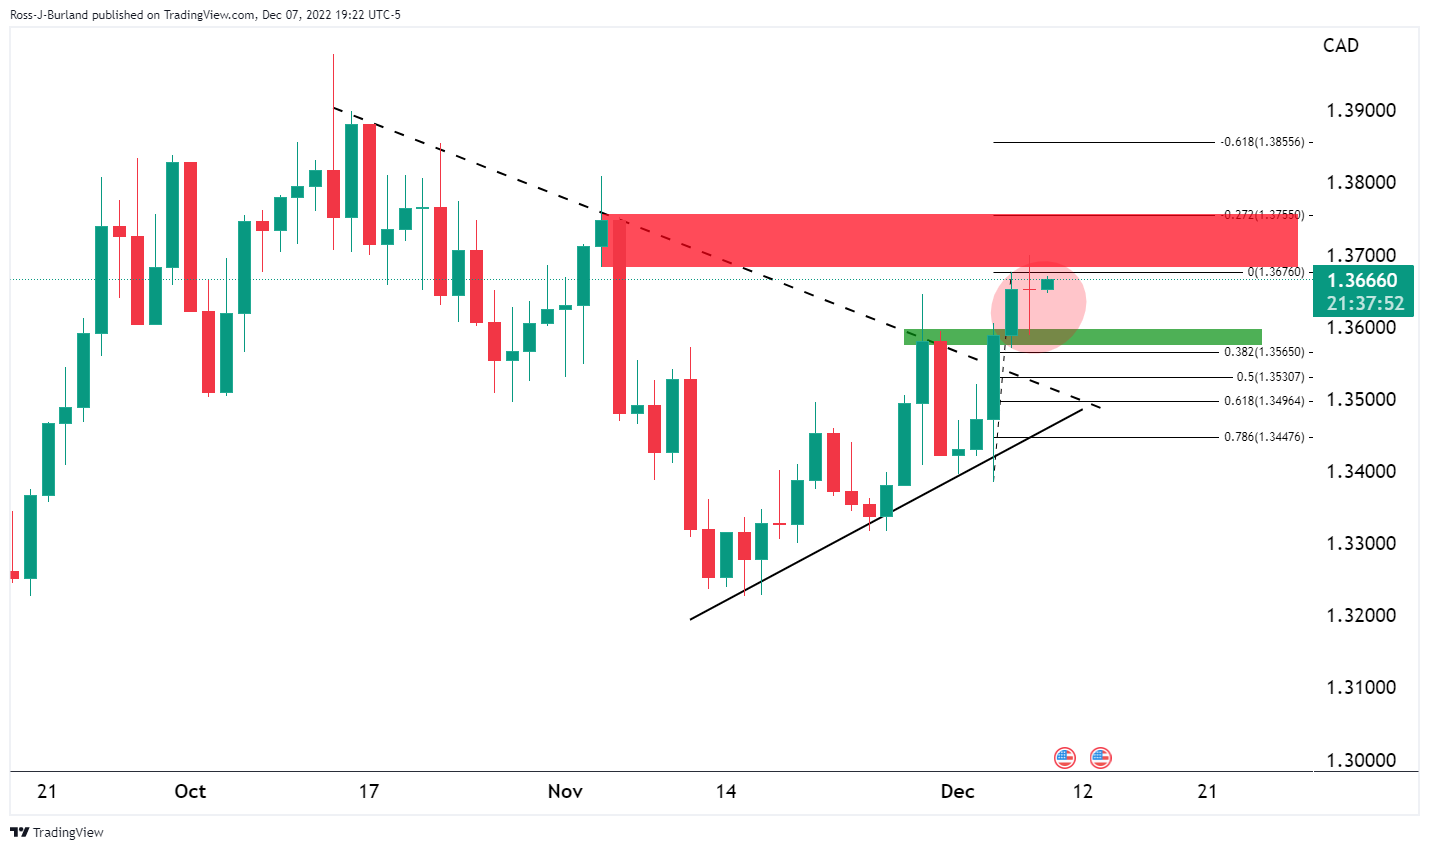
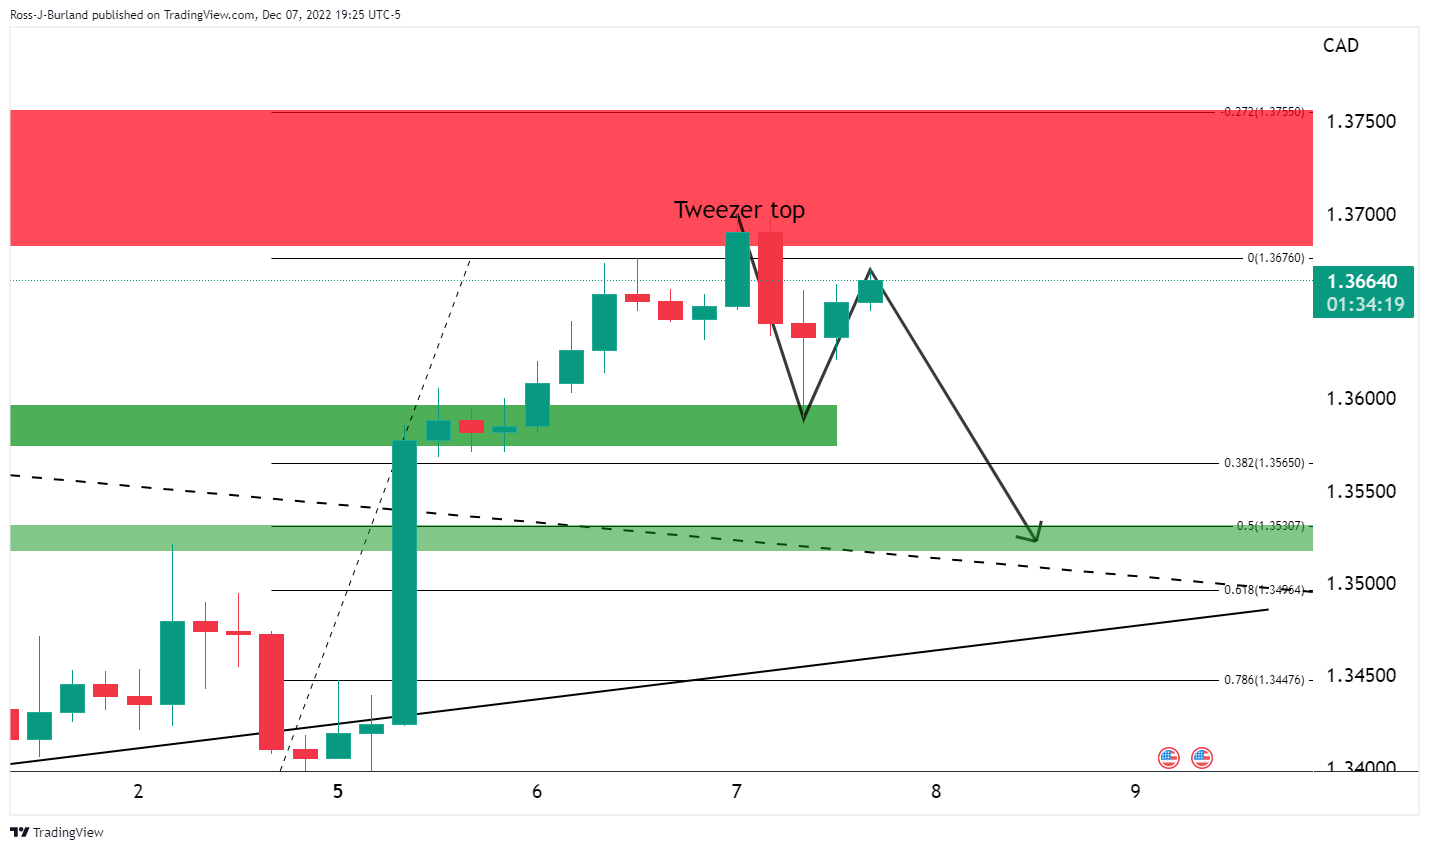
While the bias remains to the upside with the price on top of the triangle, a deeper correction could be on the cards given the strength of the correction and prospects of mitigation of a price imbalance below 1.3600.