- USD/JPY Price Analysis: Could be coiling ahead of a significant breakout
Notícias do Mercado
USD/JPY Price Analysis: Could be coiling ahead of a significant breakout
- USD/JPY bulls eye 137.50/70 and then a full 100 pips of the same until the 139s.
- On the downside, 136.50 and 136.20 align with the neckline of a harmonic pattern.
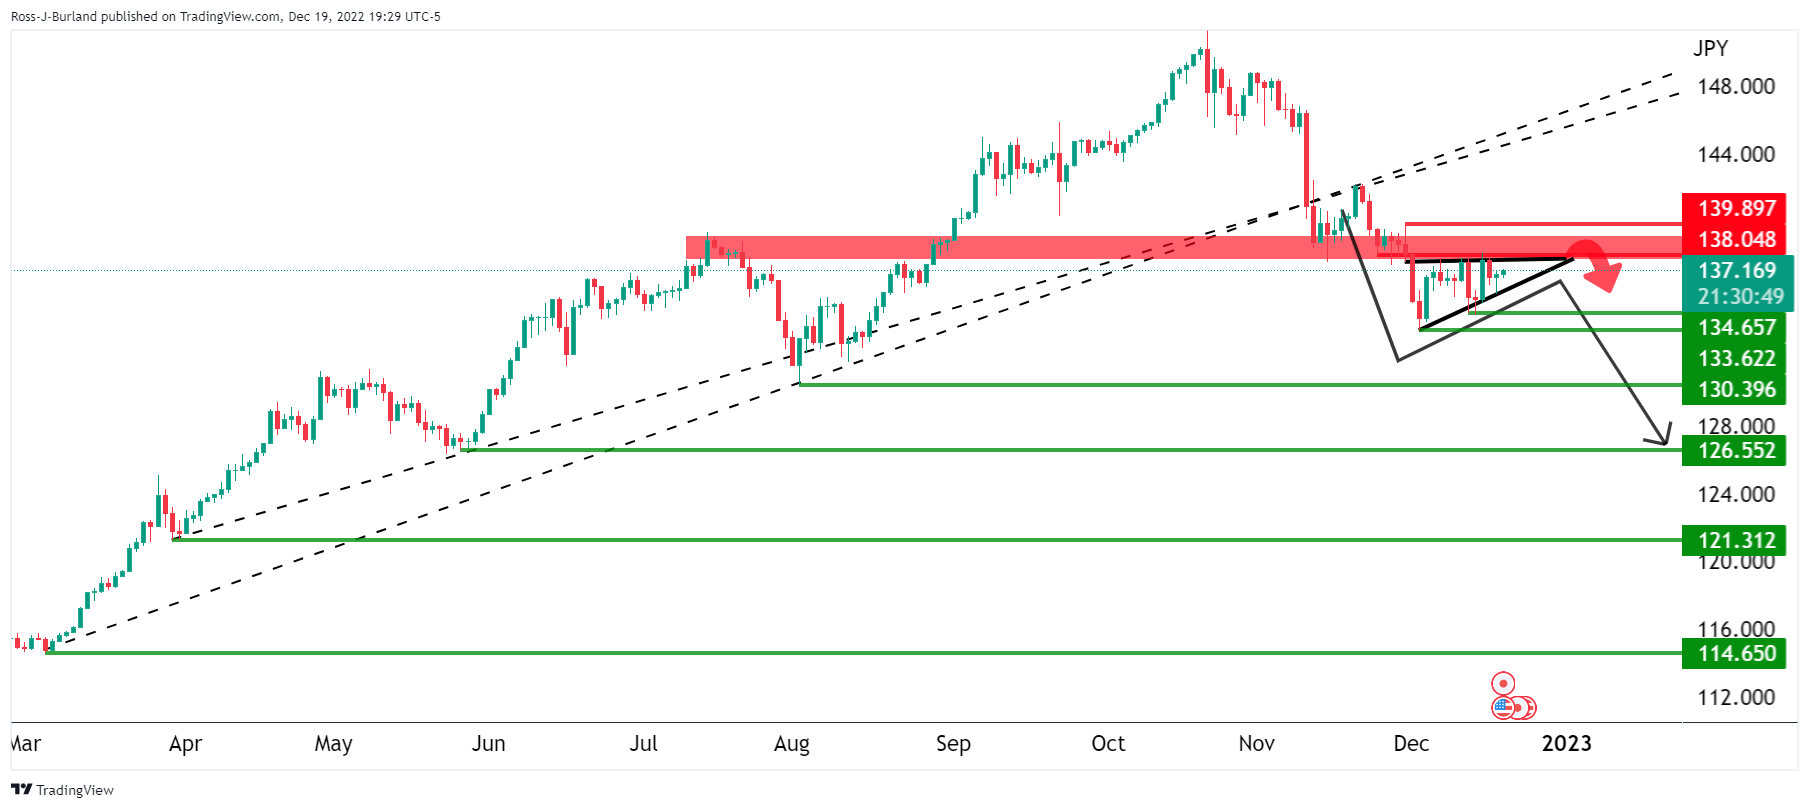
USD/JPY is in a state of consolidation, coiling below the breakout of the daily trendline support of the prior bullish cycle. The following illustrates the prospects of a downside continuation:
USD/JPY daily chart
Zoomed in ...
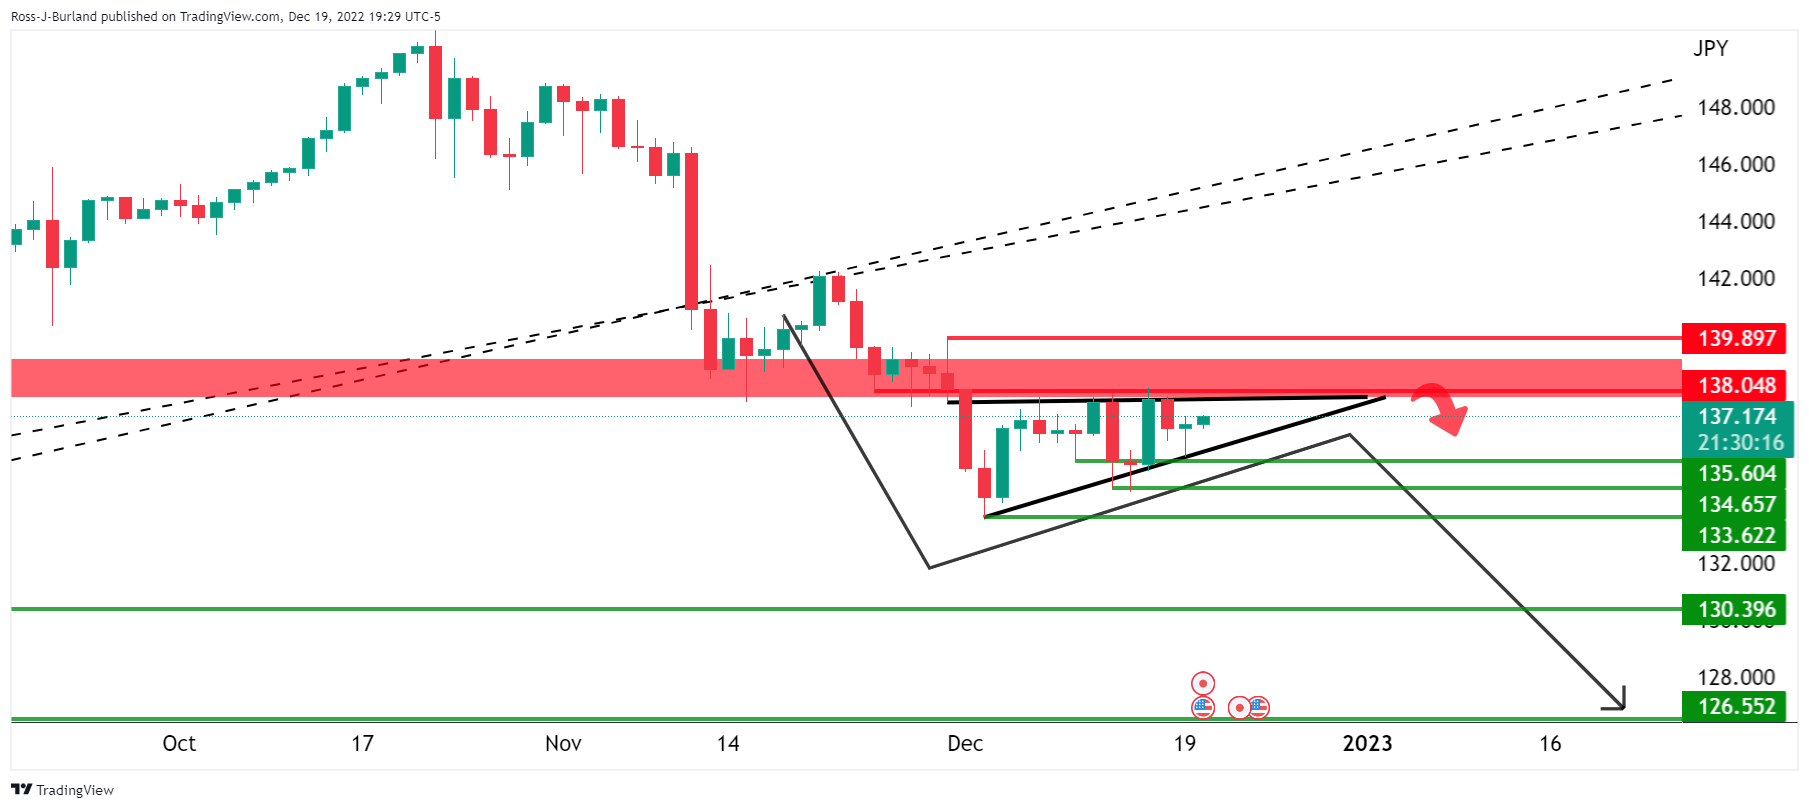
The coil is an explosive chart pattern that would expect to see some testing of the boundaries before a decisive breakout one way or the other. however, in this case, this is an ascending triangle in a downtrend, a continuation pattern. Therefore, the bias is to the downside, especially given that the price is now on the backside of the prior dominant trend. What we might see, is some pre-breakout mitigation of the price imbalances as illustrated below.
USD/JPY H4 charts
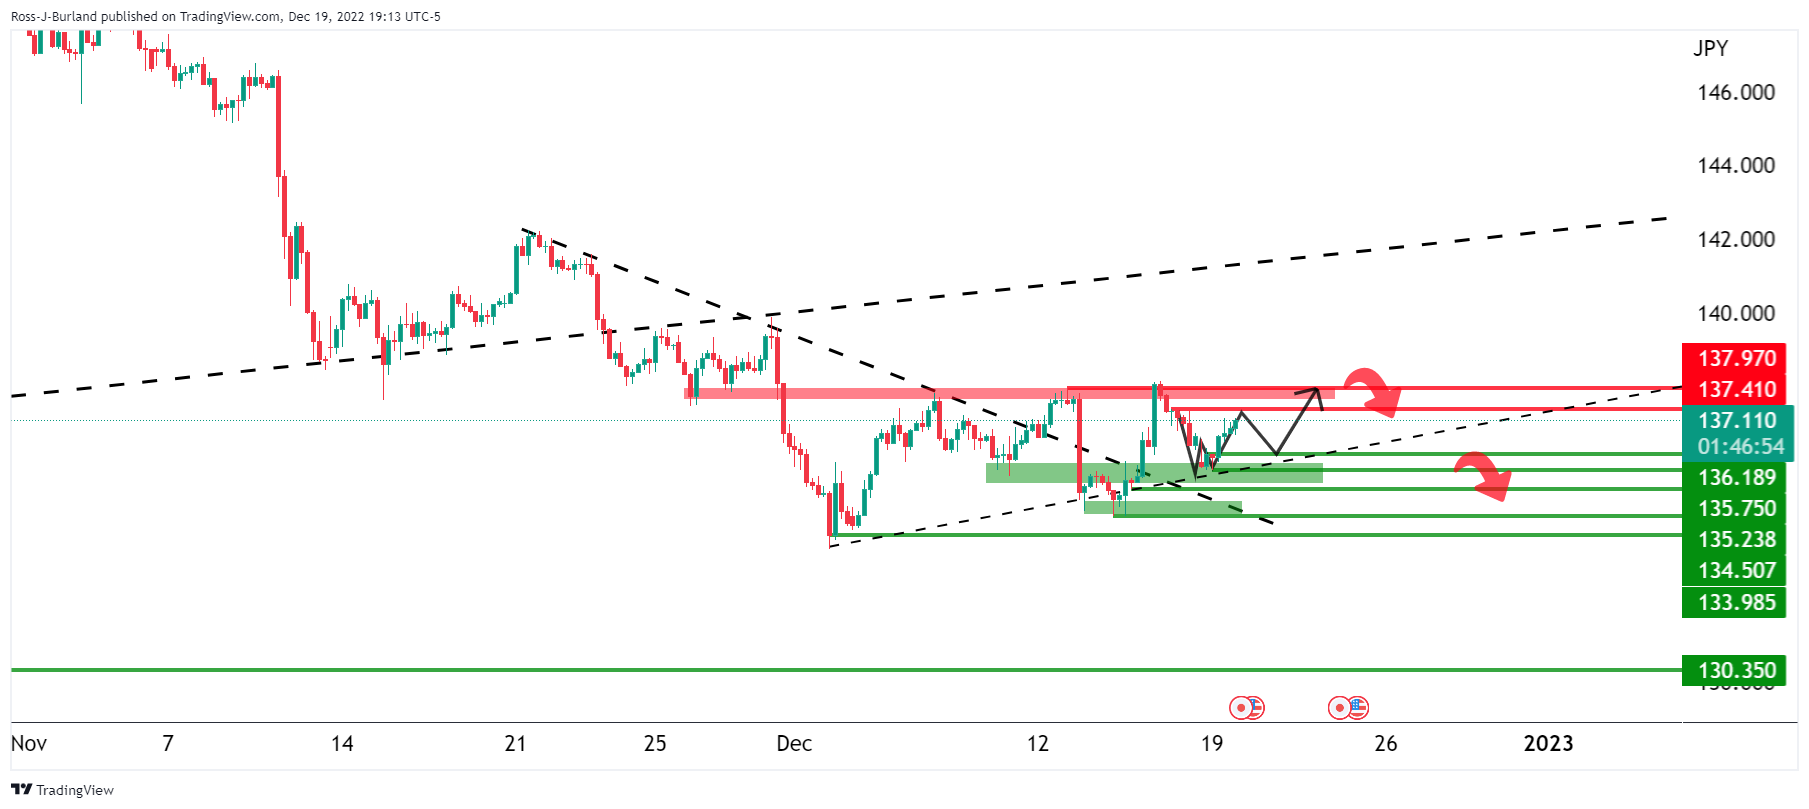
Zoomed in ...
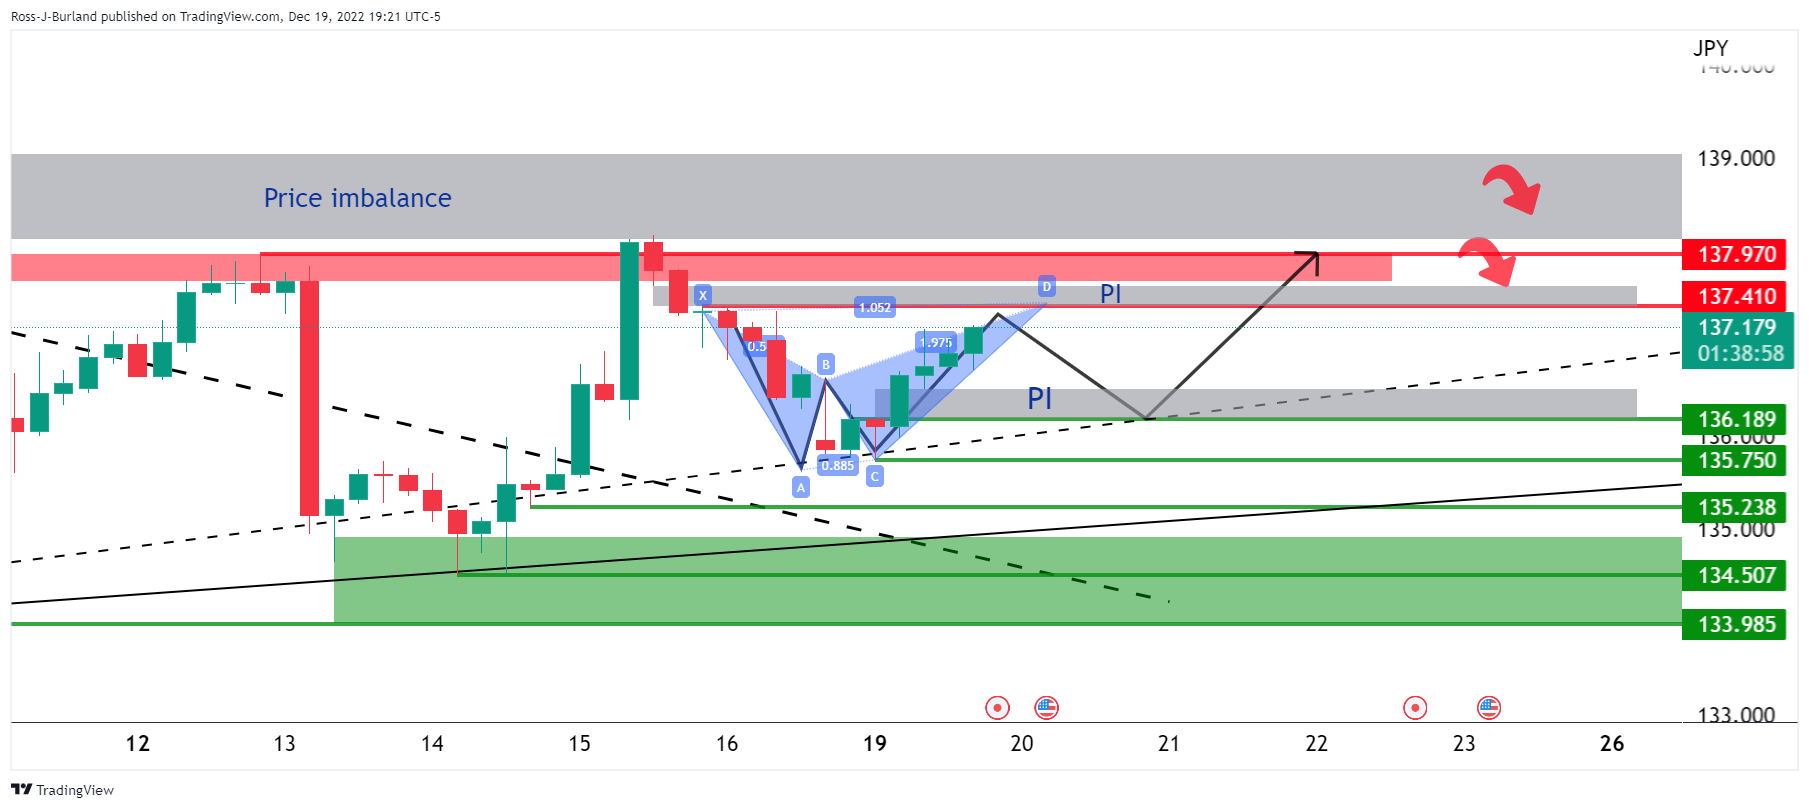
The W-formation can be considered as a bearish harmonic pattern whereby, at some stage, the bullish phase would be expected to peter out and result in a downside correction. There are two key areas of interest between then and now. The first is the price imbalance between 137.50/70 and then a full 100 pips of the same until the 139s. On the downside, there is an imbalance of price between 136.50 and 136.20 which is compelling and also align with the neckline of the harmonic pattern. A break there following the tests of the upside could be significant with regard to a downside breakout.