- Gold Price Forecast: XAU/USD bears lurk behind $1,790 amid holiday season – Confluence Detector
Notícias do Mercado
Gold Price Forecast: XAU/USD bears lurk behind $1,790 amid holiday season – Confluence Detector
- Gold price struggles for clear directions as mixed sentiment joins year-end holiday season.
- Firmer US GDP renewed hawkish Fed bets but Core PCE Inflation, Durable Goods Orders eyed for clear directions.
- China defends XAU/USD buyers ahead of the holiday-shortened week.
- Gold clings to key short-term support near $1,800 amid sluggish Treasury bond yields.
Gold price (XAU/USD) remains mildly bid as bears take a breather after a two-day downtrend. Even so, mixed catalysts challenge the metal buyers in consolidation the biggest daily fall in over a week.
That said, optimism surrounding China’s pro-growth policies and the Sino-American tussles contradict of late. However, a lack of momentum in the bond markets seems to restrict immediate XAU/USD moves as traders await the US Core Personal Consumption Expenditure (PCE) - Price Index and Durable Goods Orders for November ahead of a holiday-shortened final week of 2022.
The cautious sentiment could also be linked to the recently firmer US GDP and CB Consumer Confidence figures that renewed hawkish Fed bets. However, the US central bank hasn’t been too convincing for the XAU/USD bulls in its latest monetary policy meeting. As a result, firmer prints of the scheduled data become necessary to recall the Gold sellers.
Also read: Gold Price Annual Forecast: Will 2023 be the year Gold shines?
Gold Price: Key levels to watch
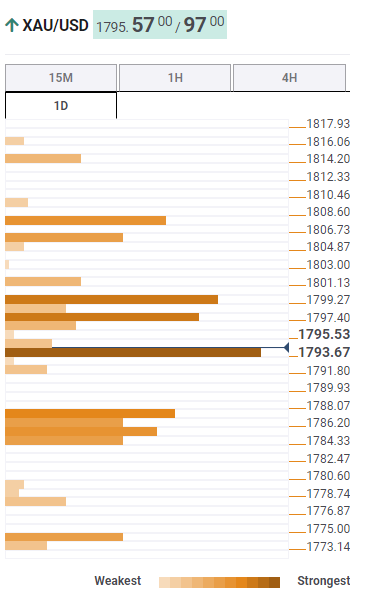
The Technical Confluence Detector shows that the gold price floats above the strong support area surrounding $1,793 which includes Fibonacci 23.6% on daily and 38.2% on weekly formation, not to forget 100-SMA on 4H and the 10-HMA.
In a case where the XAU/USD price slips beneath the $1,793 support, the previous monthly high near $1,788 could probe the bears.
Following that, Fibonacci 23.6% on weekly and middle band of the Bollinger on the 1D, around $1,785, could act as an extra downside filter.
It’s worth noting that the Gold price weakness past $1,785 won’t hesitate to slump toward the previous weekly low near $1,775.
On the flip side, a convergence of the Fibonacci 38.2% on daily and 200-HMA could test the Gold buyers near $1,800.
Also acting as an upside filter is the Fibonacci 61.8% on daily and middle band of the Bollinger on 4H, close to $1,808, as well as the Pivot Point one-day R1 near $1,815.
Here is how it looks on the tool
About Technical Confluences Detector
The TCD (Technical Confluences Detector) is a tool to locate and point out those price levels where there is a congestion of indicators, moving averages, Fibonacci levels, Pivot Points, etc. If you are a short-term trader, you will find entry points for counter-trend strategies and hunt a few points at a time. If you are a medium-to-long-term trader, this tool will allow you to know in advance the price levels where a medium-to-long-term trend may stop and rest, where to unwind positions, or where to increase your position size.