- AUD/USD Price Analysis: Volatility squeezes as US Dollar Index consolidates
Notícias do Mercado
AUD/USD Price Analysis: Volatility squeezes as US Dollar Index consolidates
- AUD/USD is displaying topsy-turvy moves in a 0.6960-0.6978 range amid caution in the market mood.
- The formation of a Rising Channel indicates an upside trend in a limited territory.
- The Aussie asset has been overlapped by the 20-EMA, which indicates a consolidation added.
The AUD/USD pair is displaying topsy-turvy moves in a tad wider range of 0.6960-0.6978 in the Asian session. The Aussie asset has turned sideways following the footprints of the US Dollar Index (DXY). The USD Index is showing a sideways profile amid uncertainty in the market after a stretched weekend.
Also, strengthening US Treasury yields has trimmed investors’ risk appetite. The 10-year US Treasury yields have climbed to near 3.54%. Meanwhile, S&P500 futures are displaying a subdued performance amid caution in the market mood.
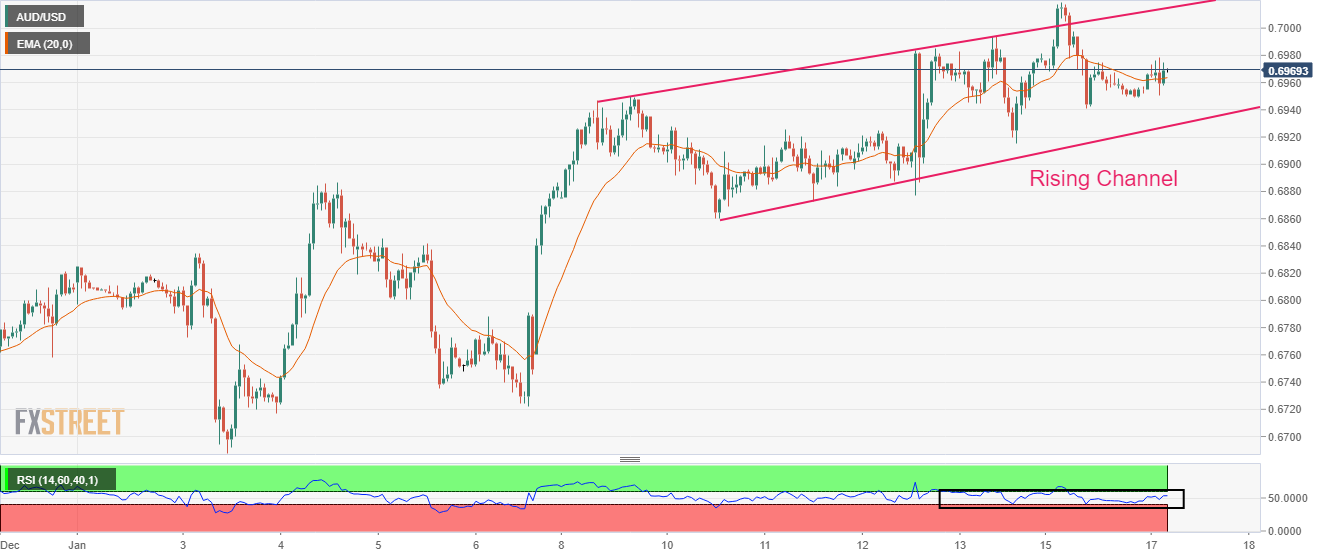
AUD/USD is auctioning in a Rising Channel chart pattern on an hourly scale, which signals a continuation of the north-side trend in a marked boundary. On Monday, the Australian Dollar failed to keep the Aussie asset on the escalated levels after a failed breakout.
The asset has been overlapped by the 20-period Exponential Moving Average (EMA) at 0.6964, which indicates a sideways auction ahead.
Also, the Relative Strength Index (RSI) (14) is hovering in the 40.00-60.00 range, which adds to the volatility contraction filters.
A decisive move above Monday’s high at 0.7019 will drive the Aussie towards August high at 0.7137. A break above August high will send the major toward June 9 high around 0.7200.
On the contrary, a downside move below December 29 low at 0.6710 will drag the major further toward December 22 low at 0.6650 followed by November 21 low at 0.6585.
AUD/USD hourly chart