- AUD/JPY Price Analysis: Drops below the 200-DMA and hovers around 91.00
Notícias do Mercado
AUD/JPY Price Analysis: Drops below the 200-DMA and hovers around 91.00
- AUD/JPY is still subdued around the crowded 91.00 area, with the 20/50/100 and 200/day EMAs meandering the area.
- AUD/JPY Price Analysis: To remain sideways amid the lack of a catalyst.
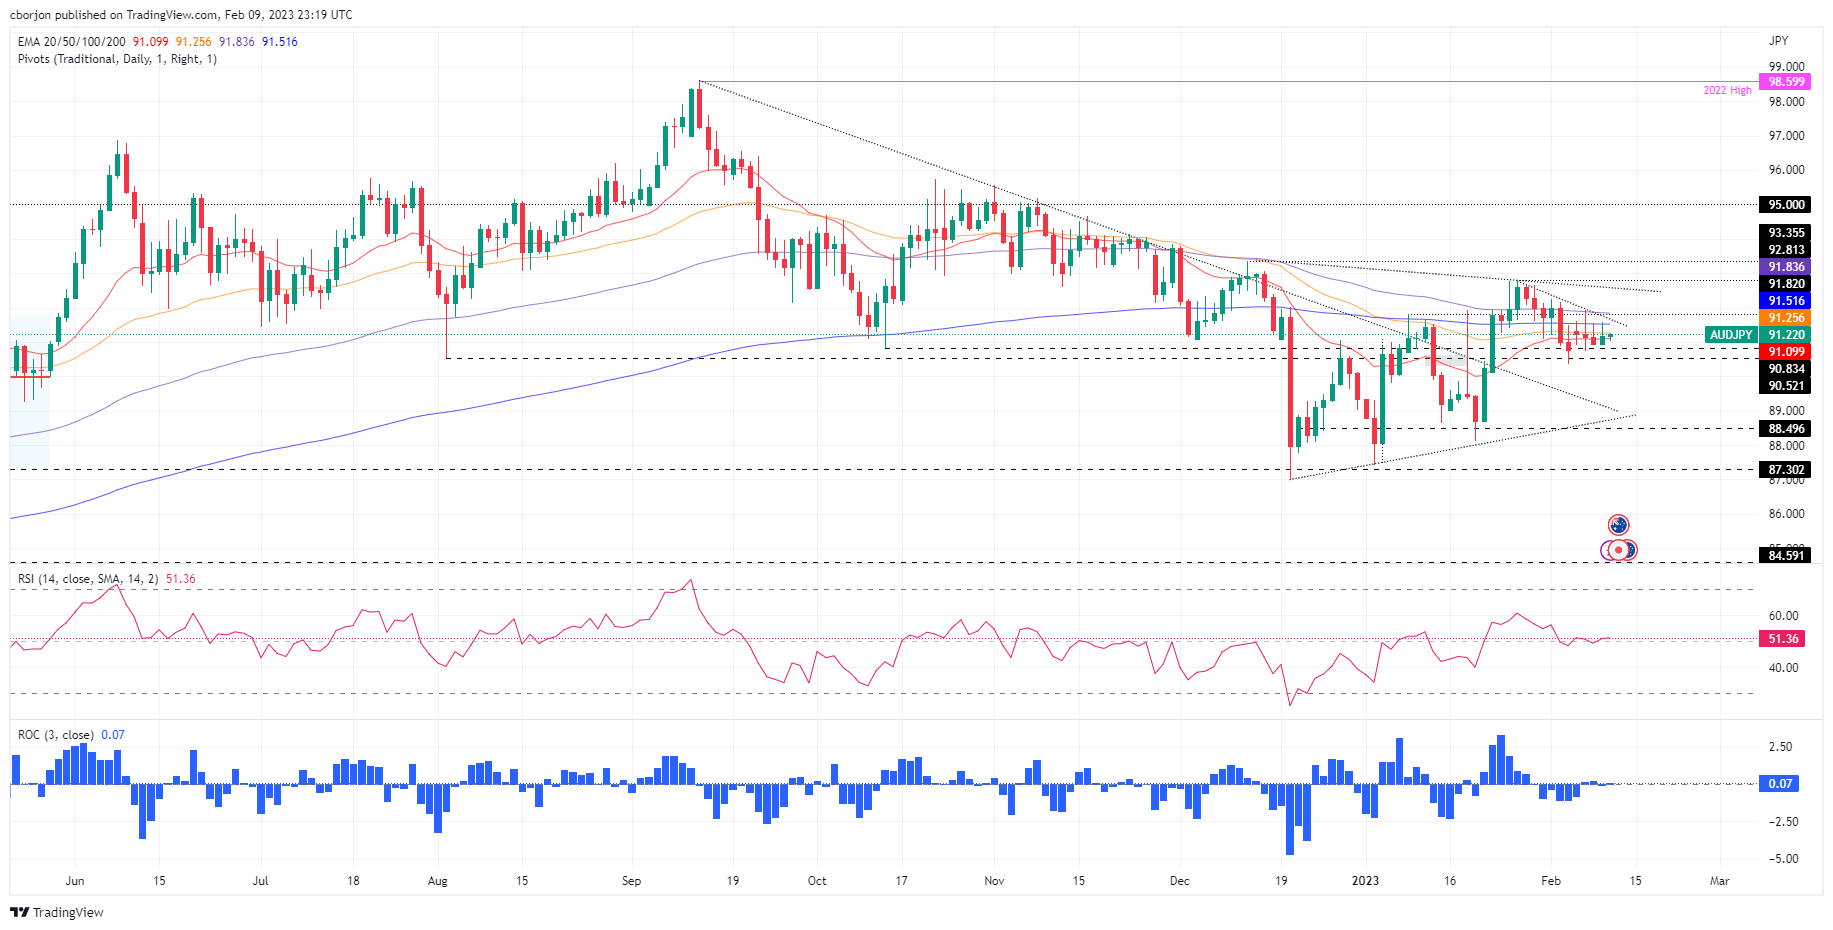
The AUD/JPY seesaws as Friday’s Asian session begins, trapped within the boundaries of the 20/50/200-day Exponential Moving Averages (EMAs), amidst the lack of a catalyst. Therefore, further sideways action is expected in the AUD/JPY, which exchanges hands at 91.15, above the 20-day Exponential Moving Average (EMA).
AUD/JPY Price Analysis: Technical outlook
The AUD/JPY daily chart portrays price action contained within a 30 to 50-pip range. The AUD/JPY key resistance levels are the 50-day EMA at 91.25, followed by the 200-day EMA at 91.51, ahead of the 100-day EMA, which is the farthest one, around 91.82. On the other hand, the AUD/JPY key support levels are the 20-day EMA at 91.09, followed by the 91.00 psychological level.
The Relative Strength Index (RSI) is in bullish territory but flat, meaning the pair has uncertainty. Meanwhile, the Rate of Change (RoC) shows volatility is shrinking, suggesting that neither buyers/sellers are in charge.
AUD/JPY key technical levels