- Gold Price Forecast: XAU/USD shows volatility contraction above $1,860 ahead of US Inflation
Notícias do Mercado
Gold Price Forecast: XAU/USD shows volatility contraction above $1,860 ahead of US Inflation
- Gold price is inside the woods above $1,860.00 as investors await US inflation for fresh cues.
- Fed Harker sees interest rates above 5% this year as inflation is still elevated.
- The monthly headline and core CPI are both expected to deliver an expansion by 0.4%, according to a Reuters poll.
Gold price (XAU/USD) is demonstrating a decline in volatility ahead of the United States inflation data for fresh impetus. The precious metal is displaying a back-and-forth motion above $1,860.00, however, the downside looks favored amid a sheer decline in the risk appetite of the market participants.
The US Dollar Index (DXY) is struggling to deliver a break above the critical resistance of 103.35 in the Asian session. S&P500 futures have added losses further as disappointment from quarterly earnings has faded optimism for the risk-perceived assets. Also, back-to-back events of shooting down unidentified flying objects on the radar of the Pentagon have dampened the market mood. The alpha created on the 10-year US government bonds has dropped marginally below 3.74%.
Renewed concerns of further interest rate hikes by the Federal Reserve (Fed) have spooked market sentiment. Philadelphia Fed President Patrick Harker sees interest rates above 5% this year as inflation is still elevated. He sees on rate cut announcement this year as higher interest rates should remain for a longer period of time to achieve price stability.
The release of the US Consumer Price Index (CPI) will provide confident guidance on interest rates. As per the consensus, monthly headline and core CPI are both expected to deliver an expansion by 0.4%, according to a Reuters poll.
Gold technical analysis
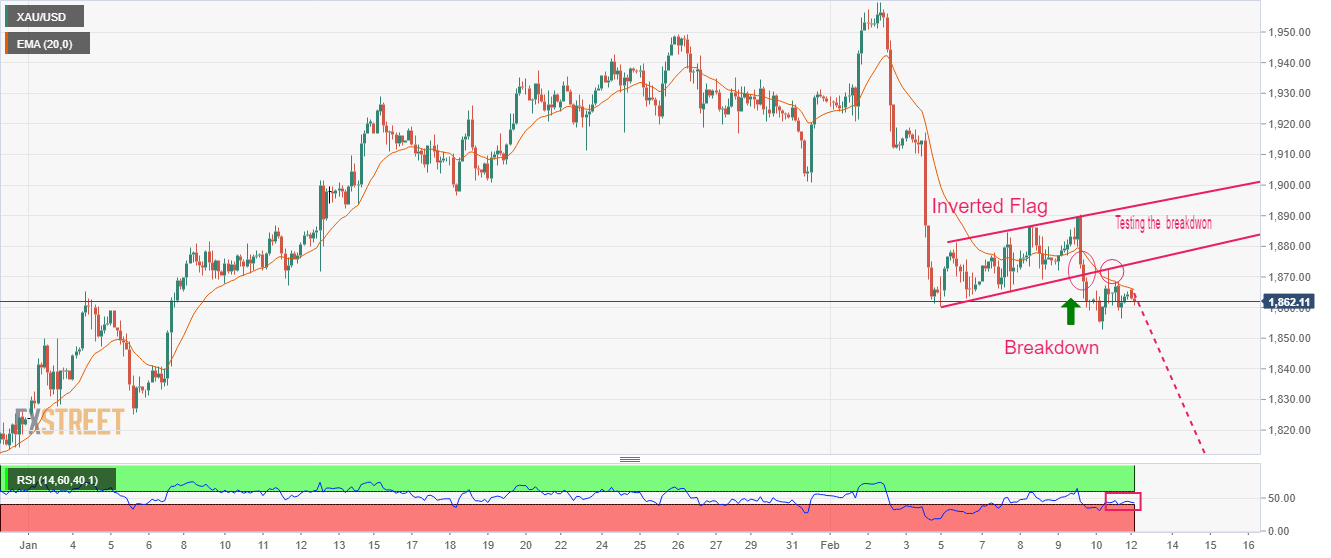
Gold price has tested the breakdown of the Inverted Flag chart pattern on a two-hour scale with weak buying strength. The yellow metal is likely to display a perpendicular downside ahead after the asset will come out of balance.
The 20-period Exponential Moving Average (EMA) at $1,866.07 is barricading Gold bulls, which indicates more weakness ahead.
Meanwhile, the Relative Strength Index (RSI) (14) is hovering near 40.00. A breakdown into the bearish range of 20.00-40.00 will activate the downside momentum.
Gold two-hour chart