- GBP/JPY Price Analysis: Struggles at the 50-DMA but solidifies its gains around 160.70
Notícias do Mercado
GBP/JPY Price Analysis: Struggles at the 50-DMA but solidifies its gains around 160.70
- The GBP/JPY rallied more than 200 pips on Monday, ahead of the release of US inflation data.
- GBP/JPY Price Analysis: Short term, could challenge 158.00; otherwise, a rally to 162.00 is on the cards.
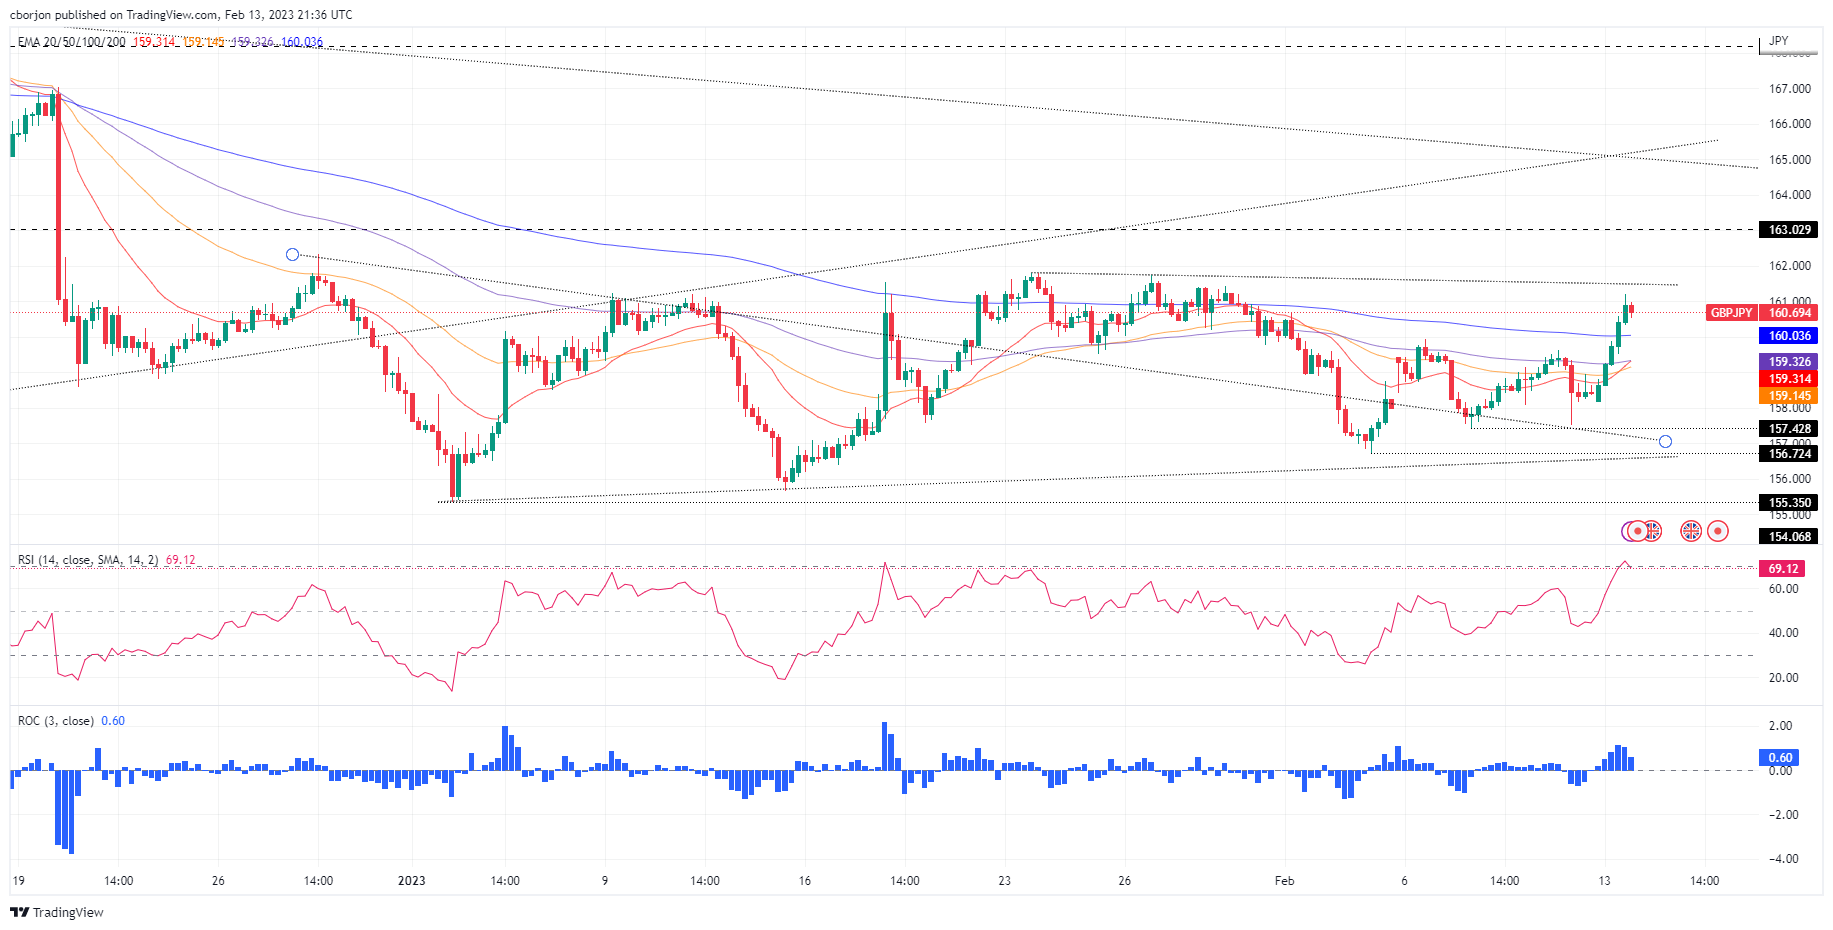
The GBP/JPY breaks above the top of a trading range, advancing sharply toward the top-trendline of a descending triangle in a downtrend, at 161.19, the day’s high, but retraced some of its gains. Hence, the GBP/JPY is trading at 160.66, above its opening price by 1.43%.
After reaching the day’s high in the session, the GBP/JPY did not hold to its gains above the 50-day Exponential Moving Average (EMA) at 160.78. That would have opened the door to challenge the confluence of the 200 and 100-day EMAs, each at 161.81 and 162.00. However, the symmetrical triangle top trendline capped the advancement as bears piled in, dragging prices lower.
In the short term, the GBP/JPY four-hour chart portrays the cross-currency as range-bound based on the EMAs residing beneath the spot price. Nevertheless, as the Relative Strength Index (RSI) turned overbought but exited from that territory, the GBP/JPY dropped from around daily/weekly highs.
If the GBP/JPY edges downwards, it will face a solid support area. Firstly the 200-EMA at 160.03, which, once cleared, could pave the way towards the 159.14/32 area, the confluence of the 20/50/100 EMAs. A decisive break will send the GBP/JPY diving towards the ascending triangle bottom trendline at around 158.18.
On the flip side, if the GBP/JPY reclaims 161.80, it will open the door to challenge 162.00.
GBP/JPY 4-Hour Chart
GBP/JPY Key technical levels