- GBP/JPY Price Analysis: Forms a doji, hovers around 163.60
Notícias do Mercado
GBP/JPY Price Analysis: Forms a doji, hovers around 163.60
- After printing an inverted hammer on Tuesday, GBP/JPY capped its fall.
- The GBP/JPY would face strong support at the confluence of the 100/200/20-day EMAs.
- GBP/JPY Price Analysis: In the near term, it’s neutral to upward biased.
The GBP/JPY finished Wednesday’s session printing a doji, meaning that neither buying/selling pressure dominated the session. Nevertheless, Tuesday’s session formed an inverted hammer, usually a bearish biased candlestick, so the GBP/JPY could extend its losses. At the time of writing, the GBP/JPY exchanges hand at 163.62
GBP/JPY Price Action
On Wednesday, the GBP/JPY traded within a 100 pip range throughout the day, though closed nearby the open. For the third time, the GBP/JPY achieved a daily close below a four-month-old downslope trendline, meaning sellers are leaning into that trendline.
The Relative Strength Index (RSI), albeit in bullish territory, is almost flat, while the Rate of Change (RoC) suggests that buying pressure is waning. Therefore, further downside is expected.
Therefore, if the GBP/JPY currency pair breaks below the daily low of 163.58 from February 28th, it would increase the likelihood of a further drop toward the weekly low of 162.59. If the currency pair falls below that level, it could reach the area where the 100 and 20-day Exponential Moving Averages (EMAs) intersect at approximately 161.89/74.
Alternatively, if the GBP/JPY currency pair rises, the first resistance level would be 164.00. If it surpasses that level, GBP buyers may push the pair towards the next level of resistance at 165.00, followed by a challenge of the year-to-date high at 166.00.
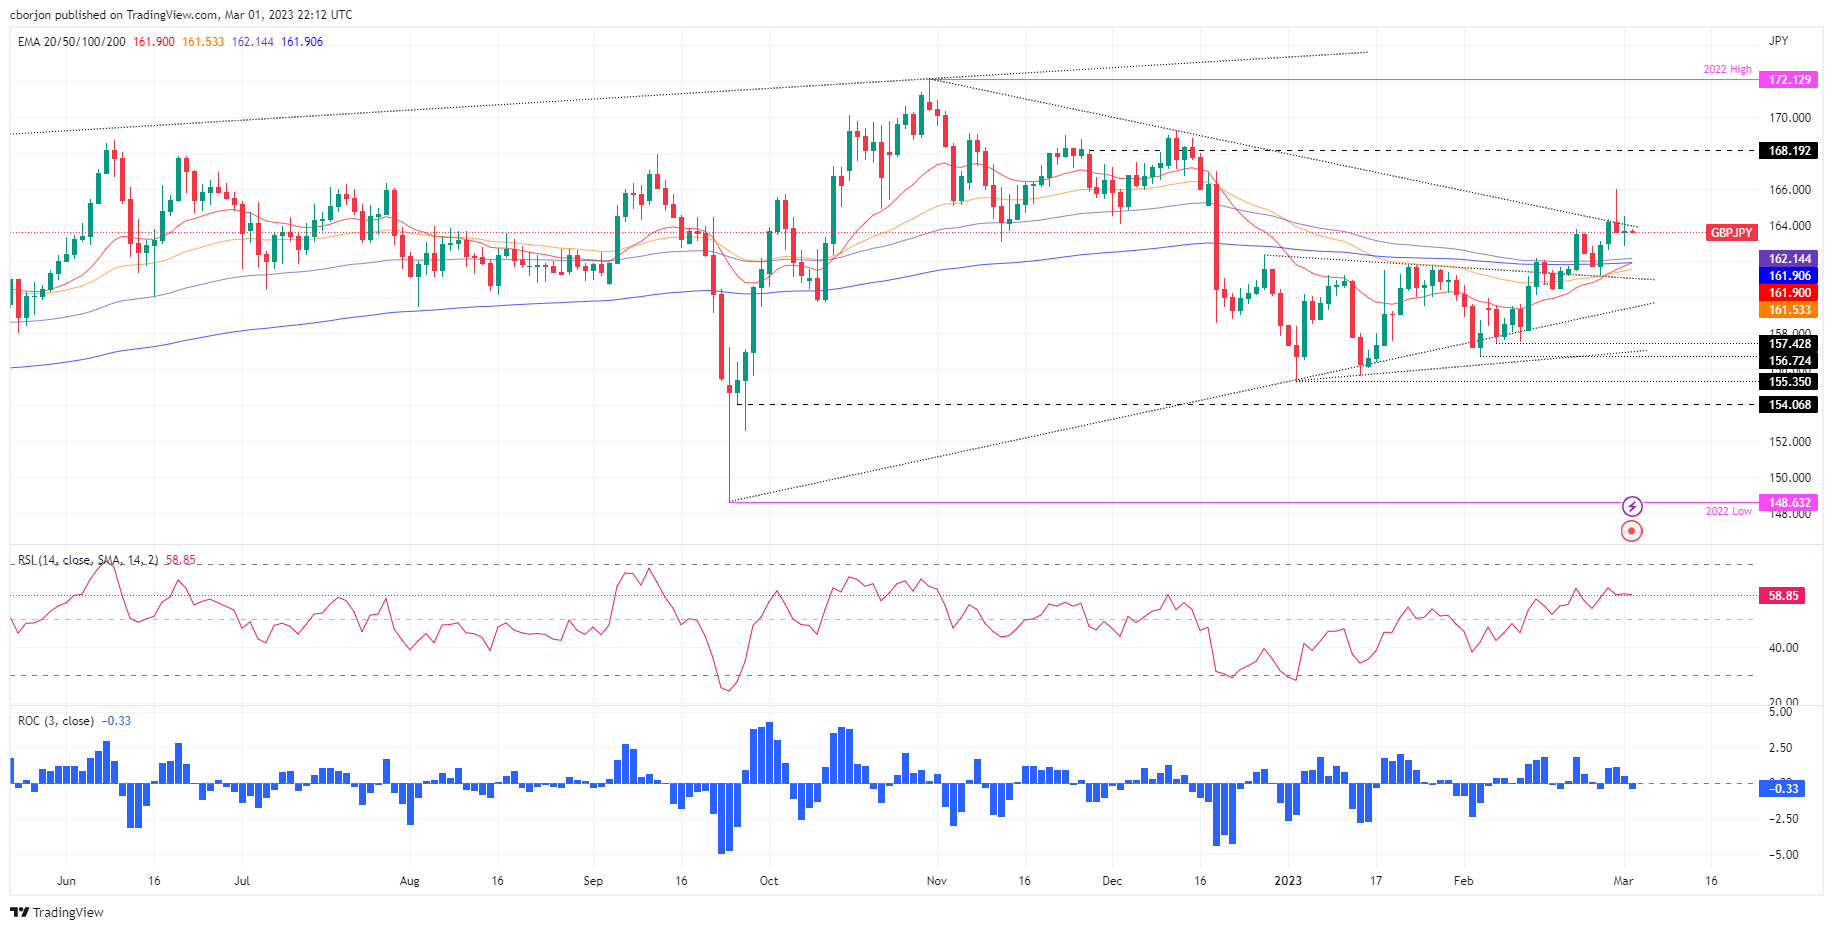
GBP/JPY Daily chart
GBP/JPY Technical levels