- USD/JPY Price Analysis: Bears in charge while below 136.50
Notícias do Mercado
USD/JPY Price Analysis: Bears in charge while below 136.50
- USD/JPY is starting the week off with a downside bias while below 136.50.
- Bears eye a continuation of the breakout below trend.
USD/JPY bears are in play and there is a bias to the downsidse following a series of bearish features taking shape on the follwing techncial analysis:
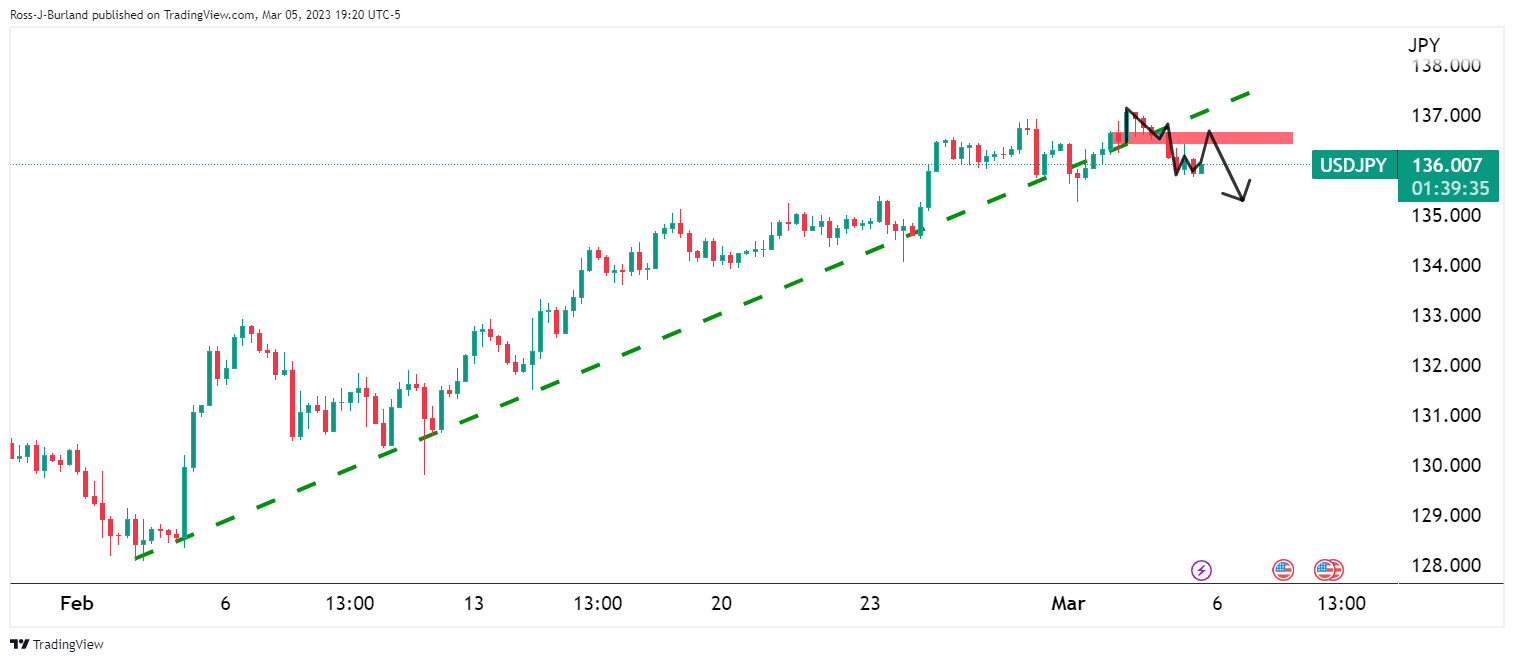
USD/JPY daily chart

The M-formation is a topping pattern and given the break of the trendline, the bias is to the downside while below the neckline of the attern near 136.50.
USD/JPY H4 chart
We have an M-formation on the 4-hour chart as well, and while the bias is for a test higher, the breakout of the grouping of the price could go either way. However, again, the bias is lower while below 136.50.
USD/JPY H1 chart
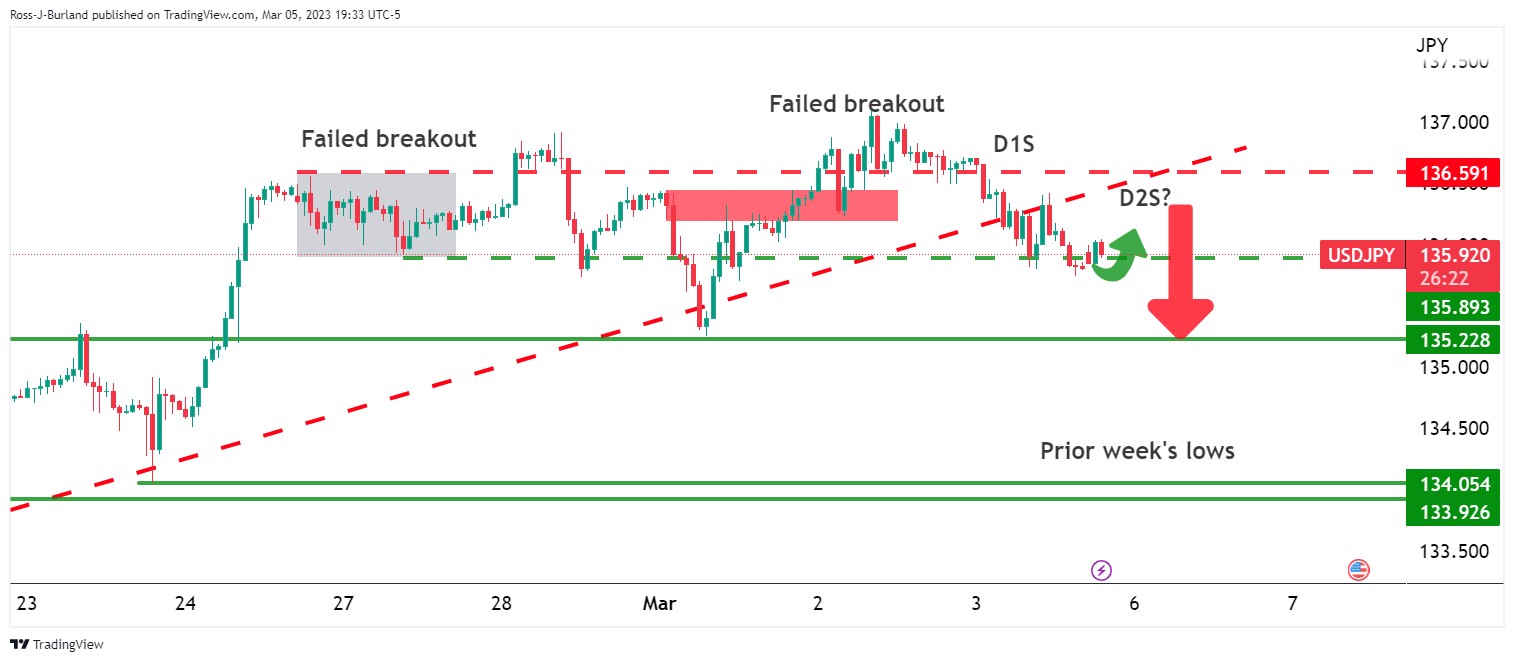
As for the hourly chart, the support below the break of the trendline is being tested while the 135.20s stay intact, so far. We have had two failed breakouts above and we are potentially on the second day of shorts in the market which again, leads to a downside bias while below 136.50.