- GBP/USD Price Analysis: Bulls are in the market and eye a bullish extension
Notícias do Mercado
GBP/USD Price Analysis: Bulls are in the market and eye a bullish extension
- GBP/USD bulls are in the market ahead of the central banks.
- Bulls are the front side of the bullish trend leaving the bias bullish near and longer term.
GBP/USD is grappling with the 1.22 area on Tuesday, keeping close to an almost seven-week high as traders reckoned banking stress could keep the Federal Reserve and the Bank of England from hiking rates much further.
The pair is on the front side of the bullish trend as we head into the central bank meetings this week and a multi-timeframe analysis determines a bullish bias for both the near-term and longer term as follows:
GBP/USD H1 chart
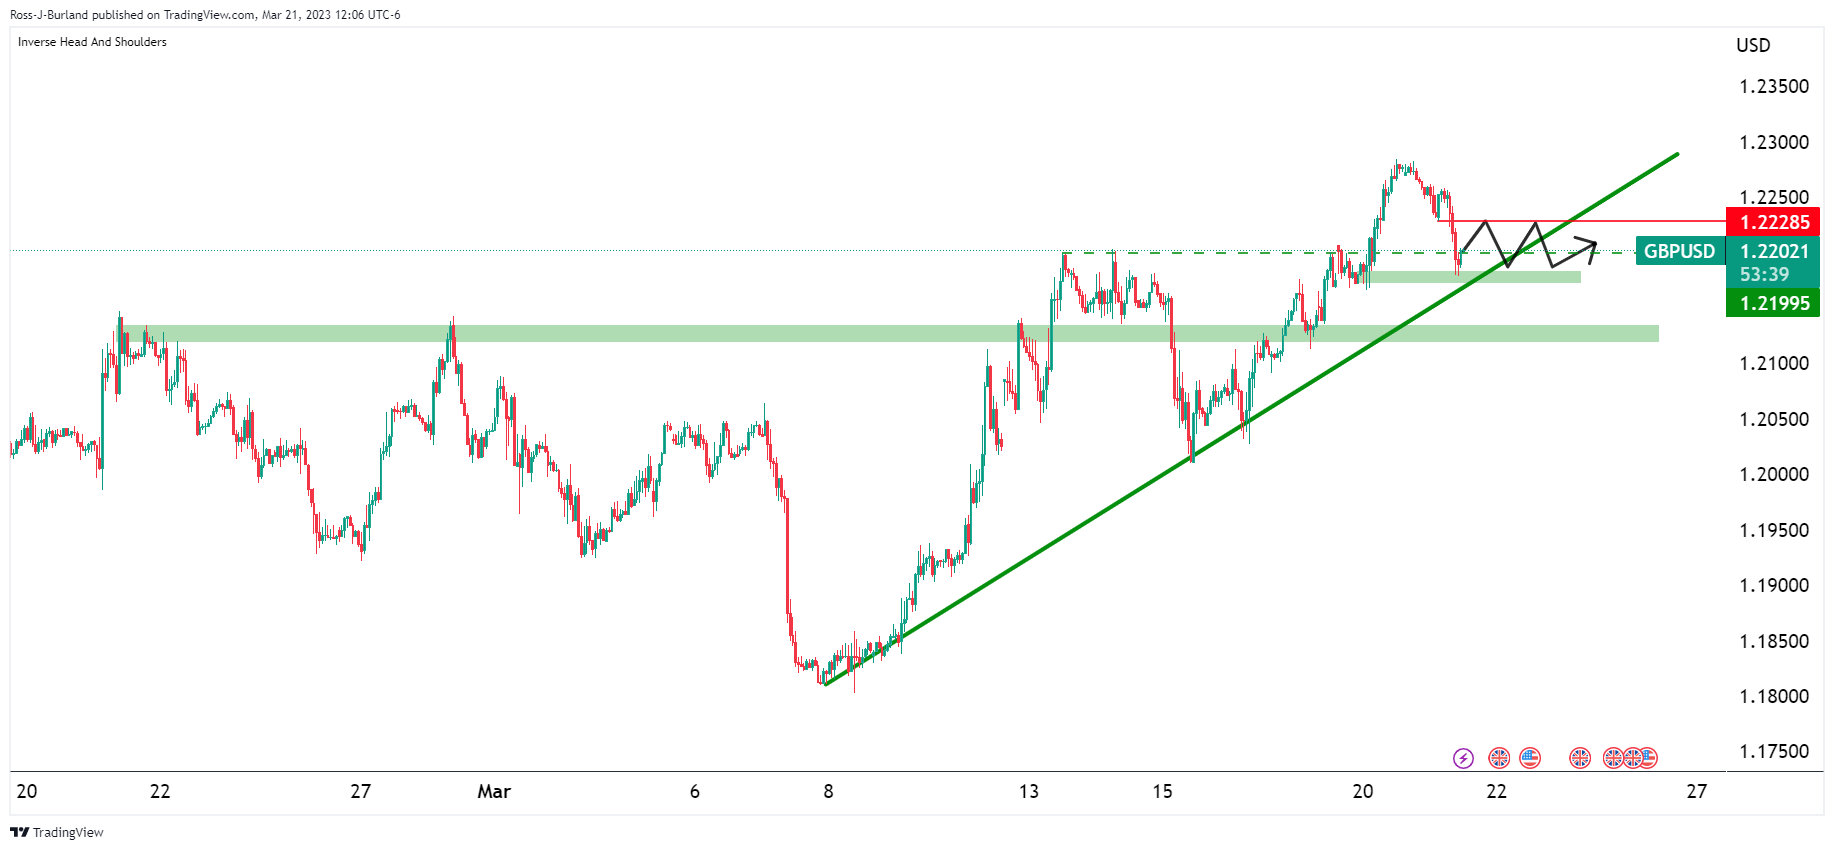
From an hourly perspective, the bulls are in control but the recent drop leaves prospects of some consolidation for the foreseeable sessions into the Federal Reserve event on Wednesday.
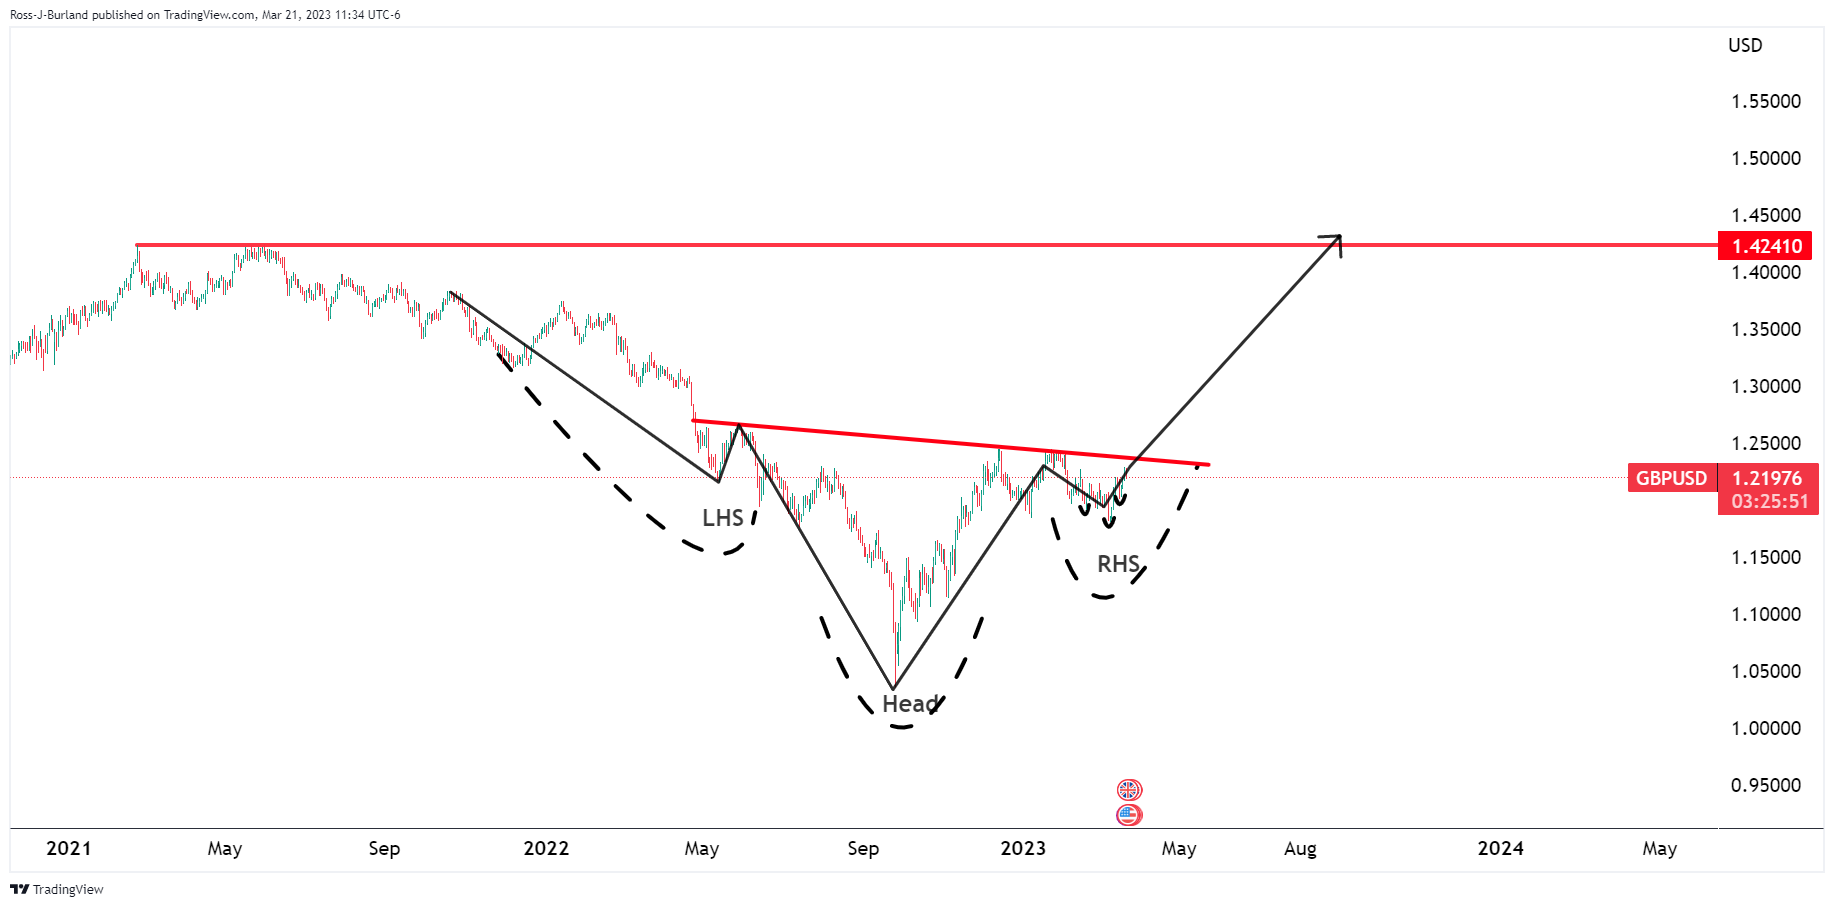
GBP/USD monthly chart
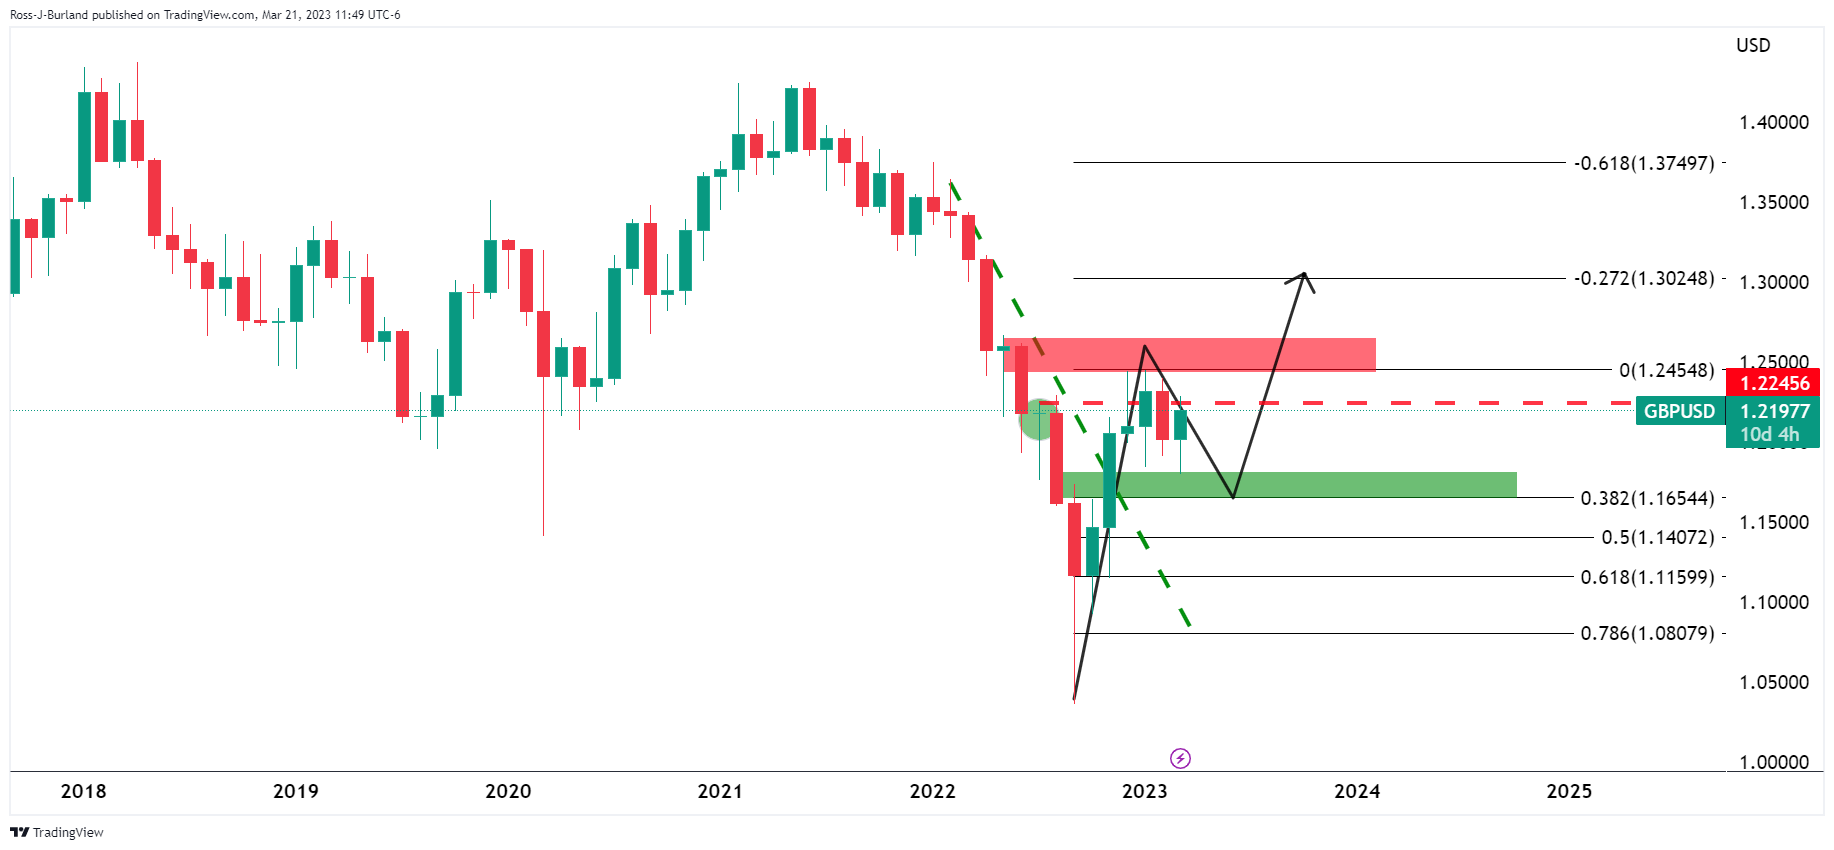
Zooming all the way out, the monthly chart shows that the market broke structure near 1.2245 but failed to hold above. The correction was relatively shallow so there are risks of a deeper move into the Fibonacci scale to at least test the 1.1650s and a 38.2% ratio. With that being said, there is just as much chance that the bulls will stay committed.
GBP/USD weekly charts
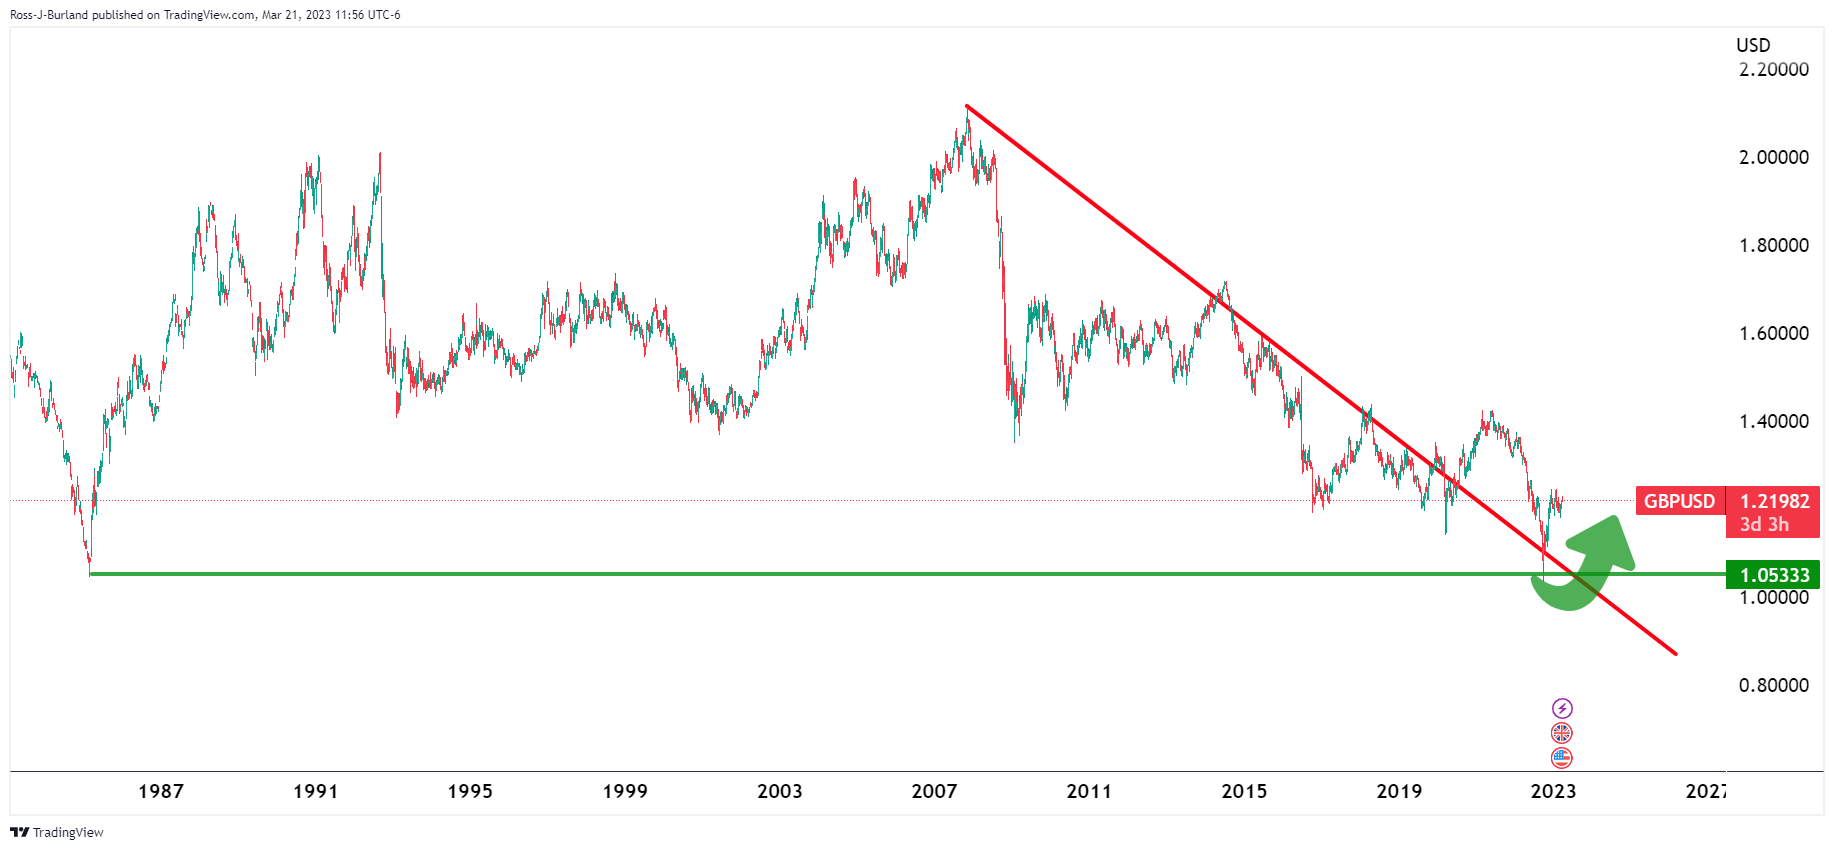
Afterall, on the weekly chart, the bear trend was broken and support has held so far.
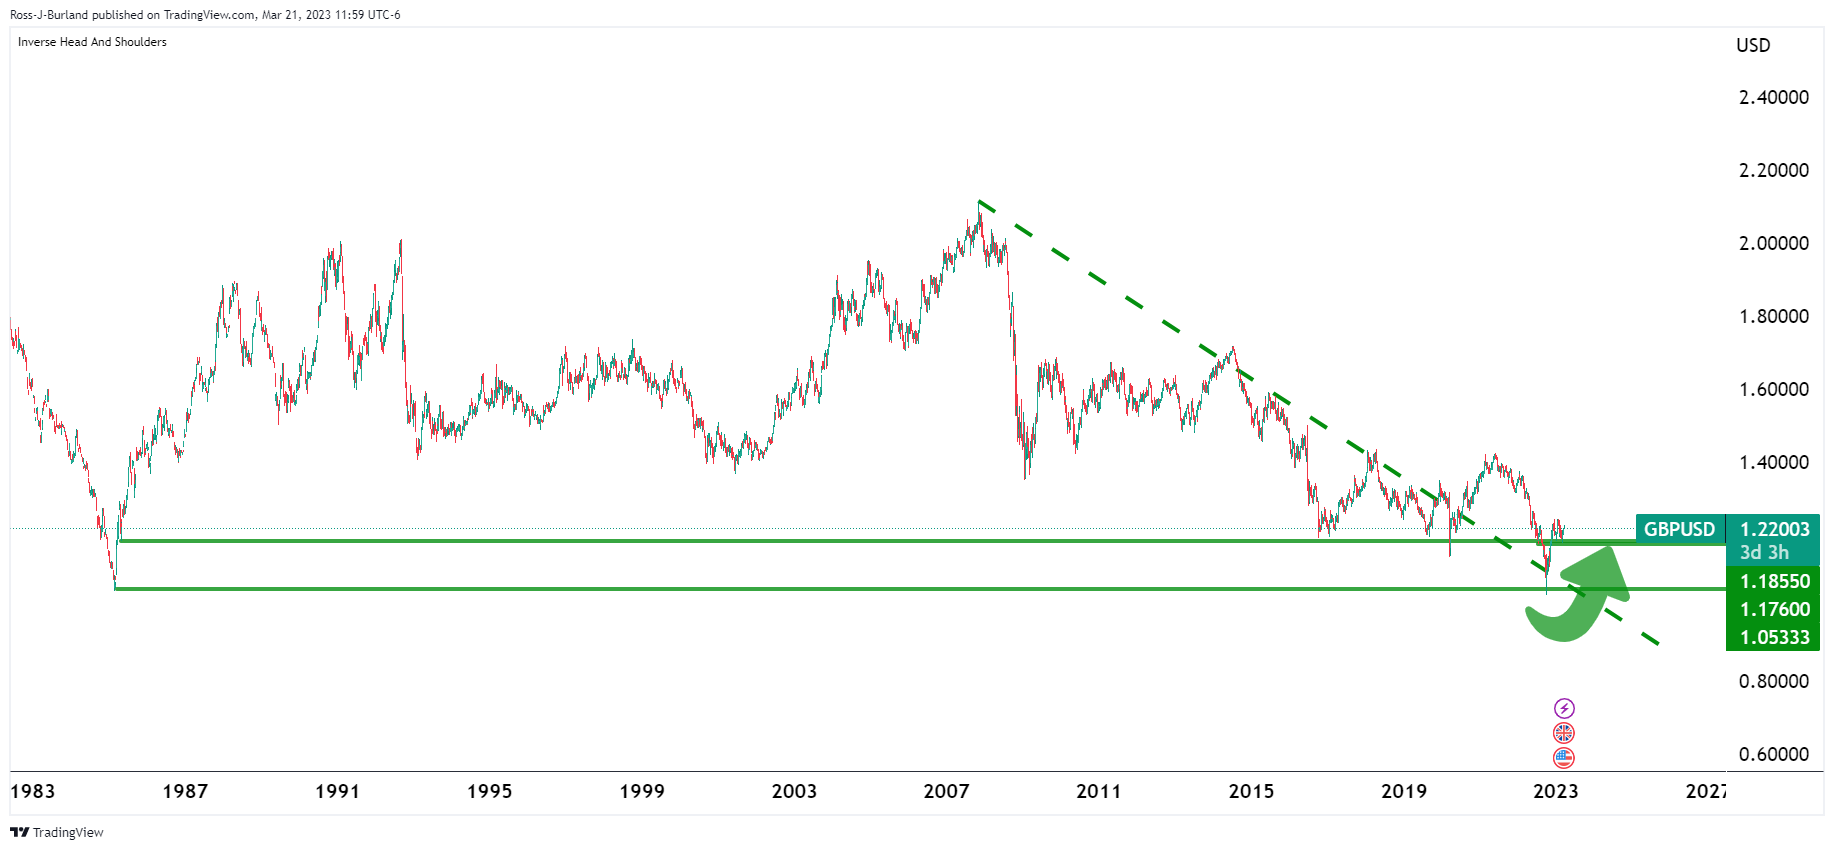
This leaves an upside bias for the weeks ahead.
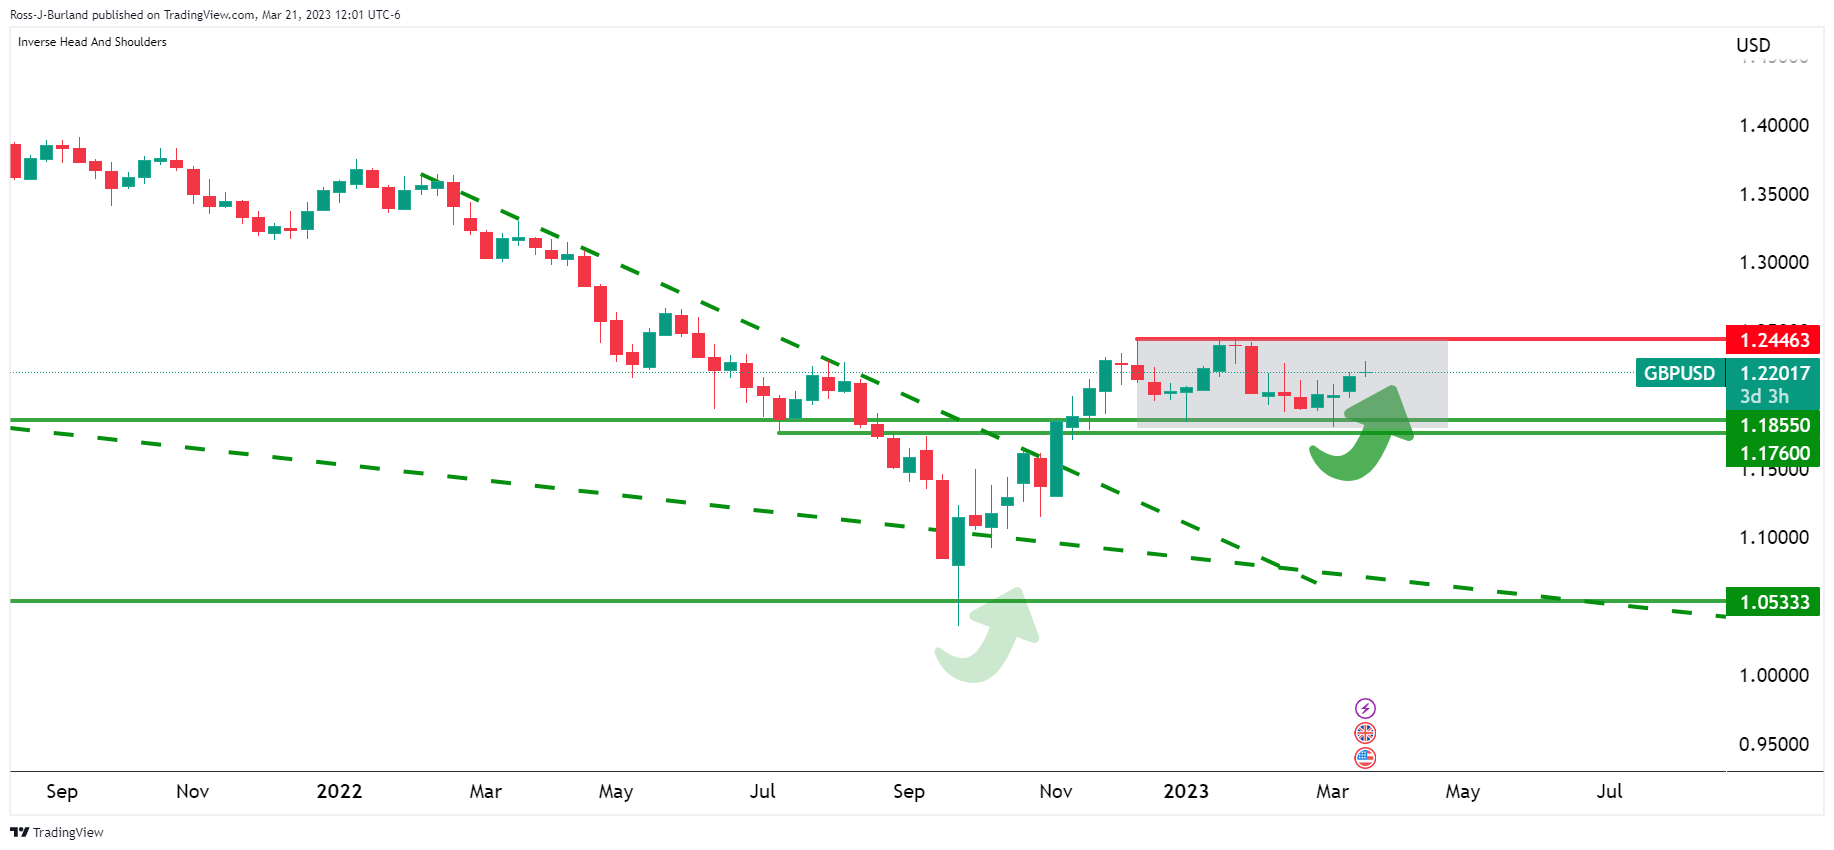
The price is in a box and there are equal highs and lows on both sides with liquidity above and below. However, the bullish bias persists while the price is on the backside of the prior bearish trend and in a phase of accumulation.
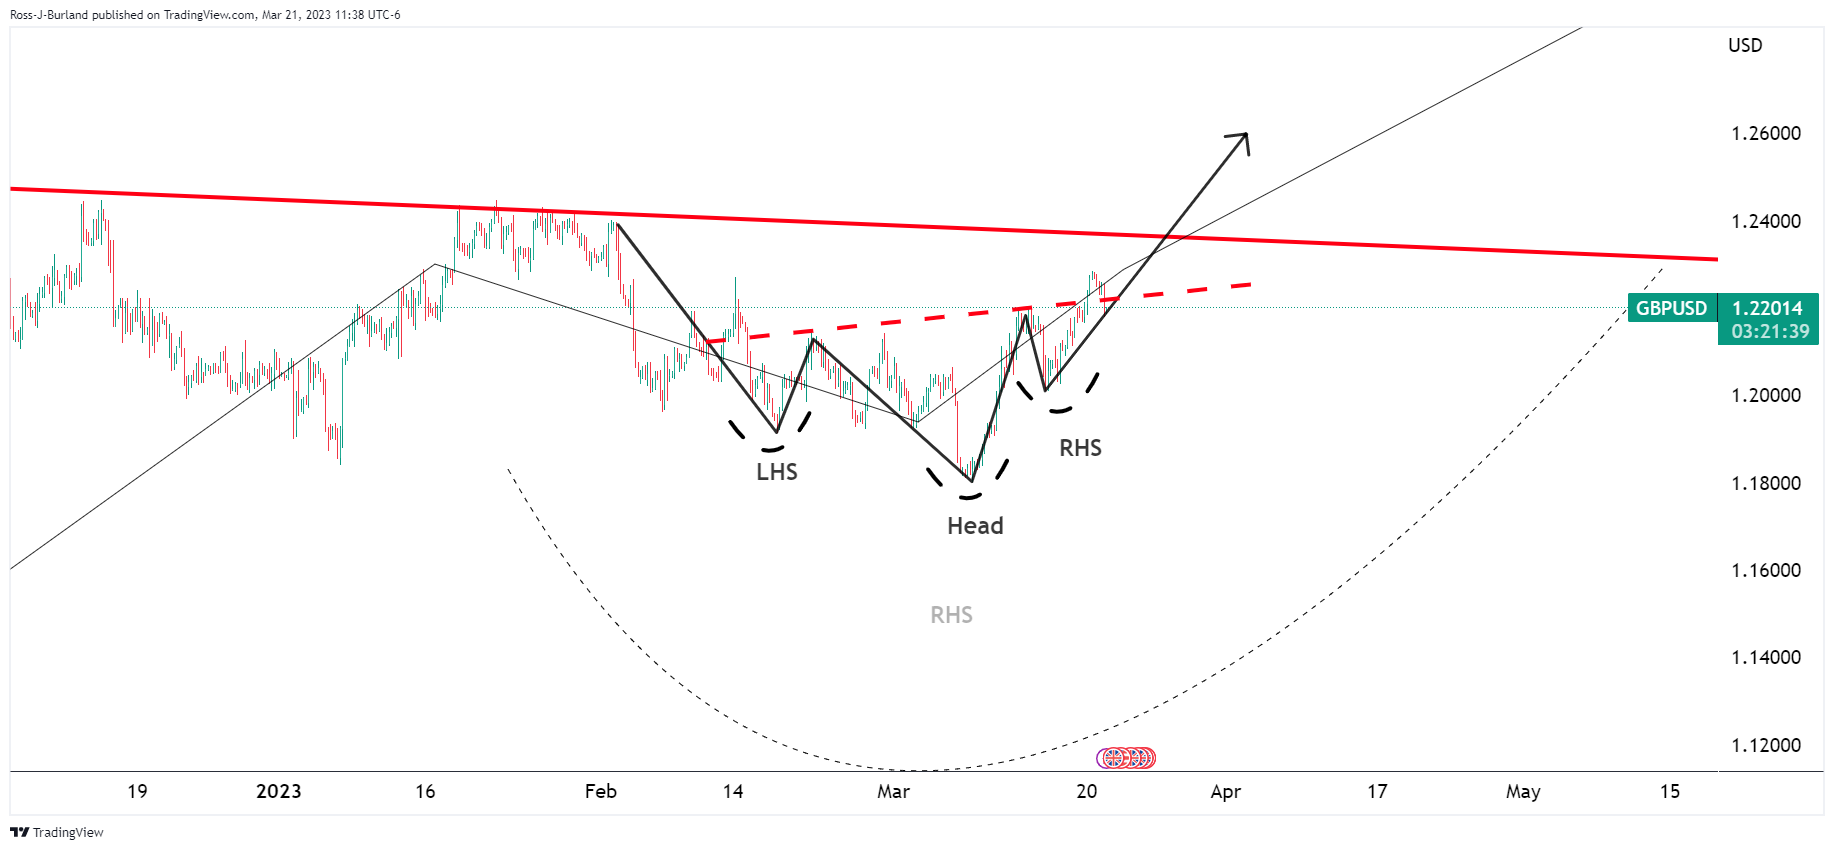
GBP/USD daily chart
There are also inverse head and shoulders on both the daily and 4-hour charts.
GBP/USD H4 charts
The 4-hour chart´s H&S´s neckline is already broken.
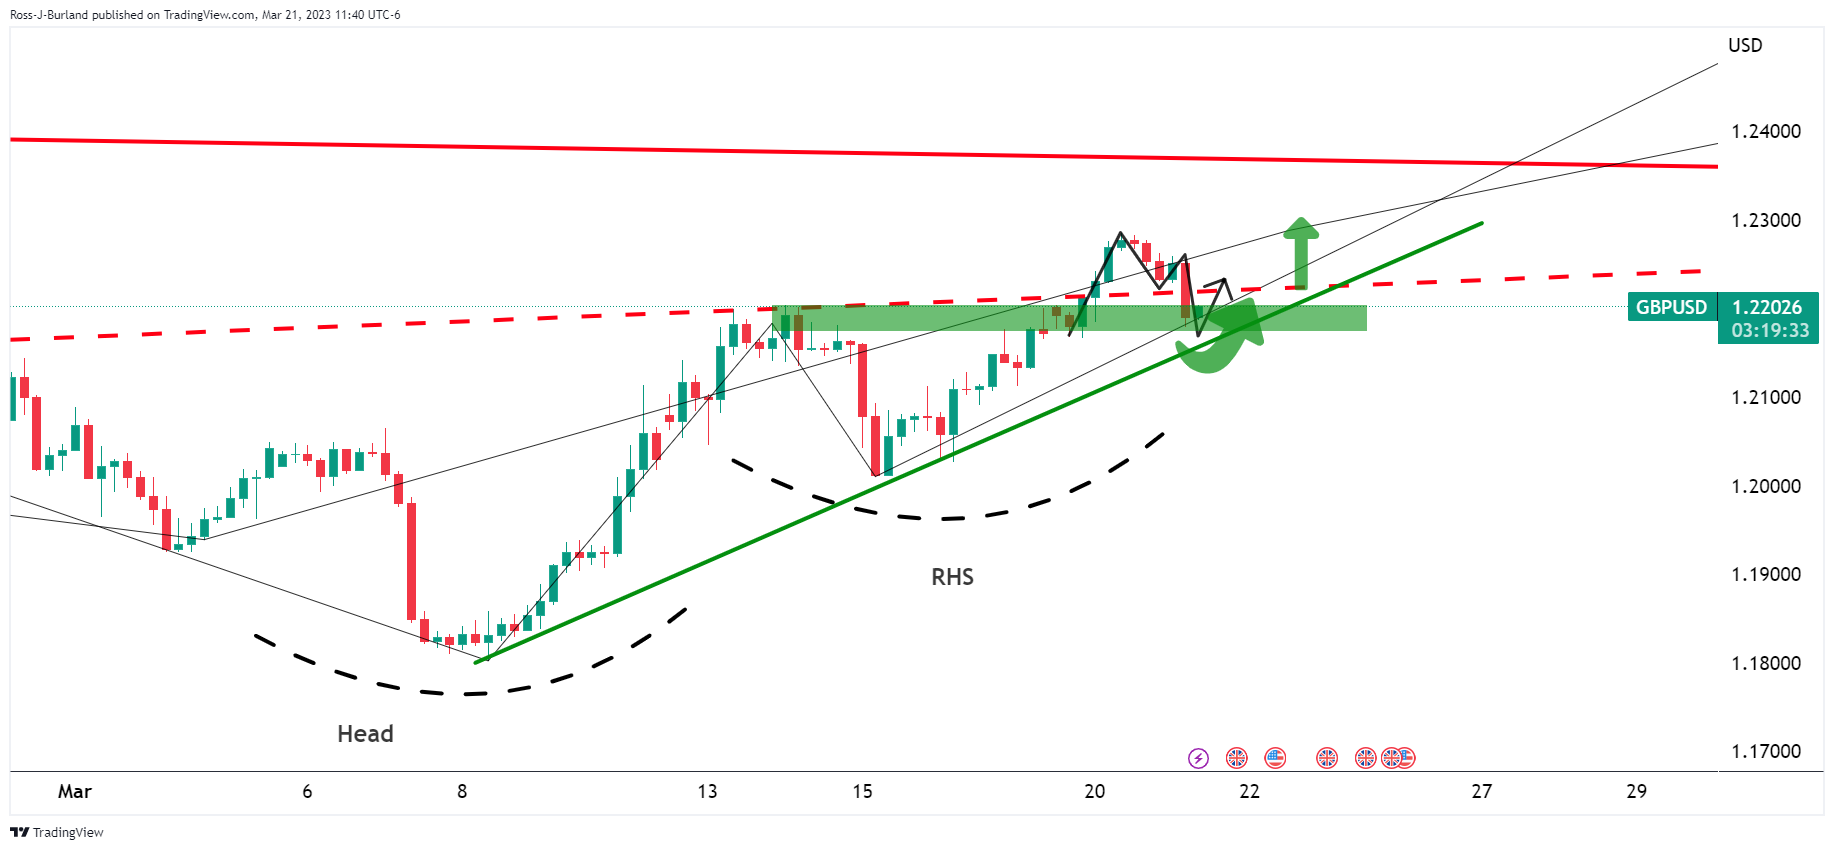
The M-formation is a reversion pattern and the price is being supported on the front side of the bullish trend.