- Silver Price Analysis: Rising wedge confirmation lures XAG/USD bears towards $22.00
Notícias do Mercado
Silver Price Analysis: Rising wedge confirmation lures XAG/USD bears towards $22.00
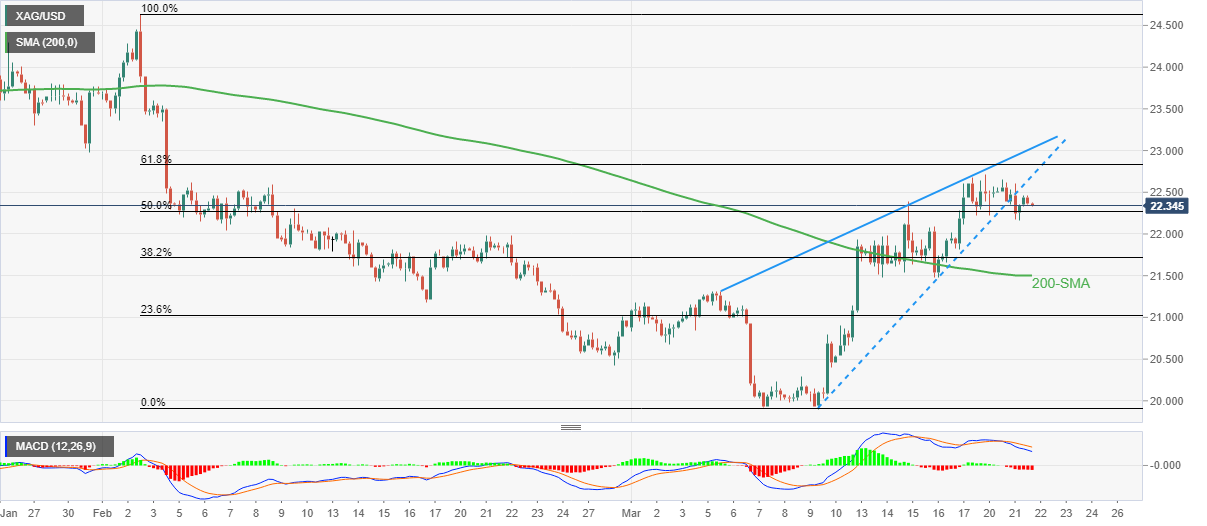
- Silver price prints three-day losing streak, confirms two-week-old bearish chart pattern.
- Bearish MACD signals add strength to downside bias for XAG/USD price.
- 200-SMA, $21.30 can act as buffers during theoretical targeting surrounding $17.10.
- Silver buyers need validation from golden Fibonacci ratio.
Silver price (XAG/USD) remains depressed around $22.30, making rounds to intraday low during a three-day downtrend heading into Wednesday’s European session.
The bright metal’s latest fall could be linked to the confirmation of a two-week-old rising wedge bearish chart pattern, as well as the bearish MACD signals.
That said, the quote is well-set for visiting the 200-Simple Moving Average (SMA) support level surrounding $21.50 before declining towards the theoretical target of $17.10.
It’s worth noting that the late February swing high and the current monthly low, respectively around $22.00 and $19.90, can act as additional downside filters to watch during the XAG/USD’s further downside.
On the flip side, the stated wedge’s lower line acts as an immediate resistance for the Silver price of around $22.70.
Following that, the 61.8% Fibonacci retracement of the metal’s February-March downside, also known as the “golden Fibonacci ratio”, could challenge the Silver buyers near $22.85.
In a case where the XAG/USD remains firmer past $22.85, the aforementioned bearish chart pattern’s top line joins the late January swing low to highlight the $23.00 as a tough nut to crack for the Silver bulls before giving them control.
Silver price: Four-hour chart

Trend: Further downside expected