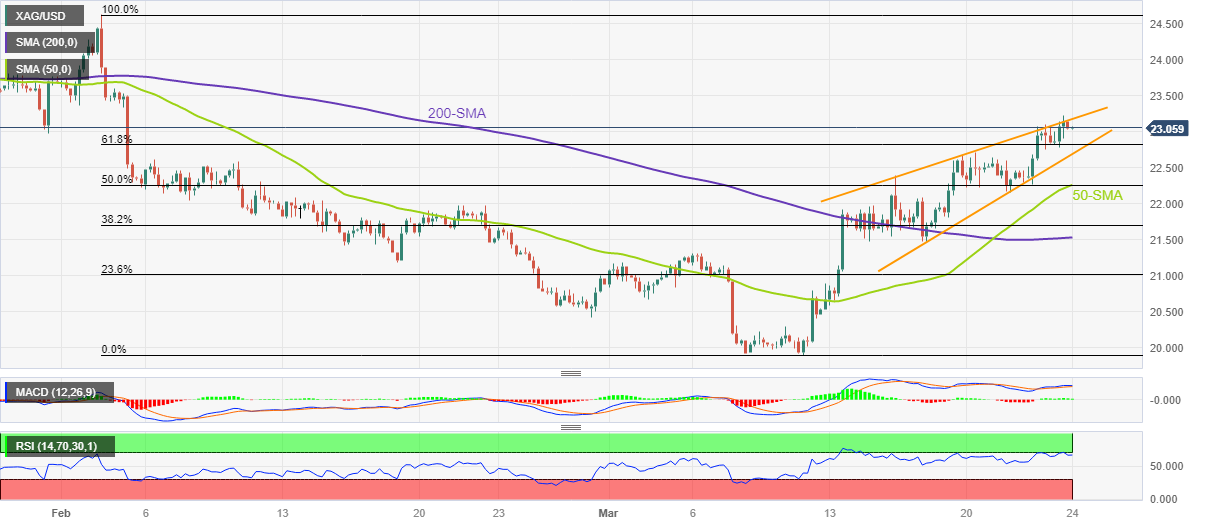
- Silver Price Analysis: Rising wedge near multi-day high teases XAG/USD bears, $22.70 eyed
Notícias do Mercado
Silver Price Analysis: Rising wedge near multi-day high teases XAG/USD bears, $22.70 eyed
- Silver prices retreats from seven-week high, portrays a bearish chart formation.
- Overbought RSI, sluggish MACD signals add strength to downside bias.
- Key SMAs can test the XAG/USD sellers; bulls need validation from $23.60.
Silver price (XAG/USD) drops to $23.00 as it snaps a two-day winning streak while reversing from the highest levels since early February on Friday. In doing so, the bright metal prints a one-week-old rising wedge bearish chart formation and lures the sellers due to the pattern’s positioning at the multi-day top.
Adding strength to the downside bias could be the sluggish MACD signals and the overbought conditions of the RSI (14) line.
As a result, the XAG/USD is likely to decline further toward the 61.8% Fibonacci retracement level of the metal’s fall during the February-March period, around $22.80.
However, the quote’s further declines hinge on its ability to break the stated wedge’s lower line, around $22.60 at the latest.
Following that, the 50-SMA and 200-SMA can entertain the XAG/USD sellers around $22.30 and $21.55 during the theoretical south-run towards the early March swing high surrounding $21.30.
Alternatively, recovery moves need to cross the $23.20 hurdle to defy the bearish chart formation.
Even so, multiple hurdles marked around $23.60 can prod the Silver buyers before directing them to the previous monthly high surrounding $24.65.
Overall, Silver price is likely to witness a pullback but the road towards the south appears limited.
Silver: Four-hour chart

Trend: Further downside expected