- Silver Price Analysis: XAG/USD poised to test last week’s highs after reclaiming $23.00
Notícias do Mercado
Silver Price Analysis: XAG/USD poised to test last week’s highs after reclaiming $23.00
- Silver’s daily chart indicates a neutral to upward bias, although the 20-day EMA crossed above the 50-day EMA.
- The appearance of back-to-back hammers on Friday and Monday could signal a possible pullback.
- XAG/USD Price Analysis: Bounces off 20-EMA, set to challenge resistance at $23.09
Silver price clashes with solid resistance and dwindles after hitting a daily high of $23.26. At the time of writing, the white metal is down 0.69%, trading at $23.06, a troy ounce.
XAG/USD Price action
Silver’s daily chart suggests the XAG/USD is neutral to upward biased, with the 20-day Exponential Moving Average (EMA) crossing above the 50-day EMA. Nevertheless, back-to-back hammers, last Friday’s inverted and Monday’s price action, could open the door for a pullback. In bullish territory, the Relative Strength Index (RSI) favors higher prices, but its slope turned south, while the Rate of Change (RoC) is neutral. That said, mixed signals warrant caution.
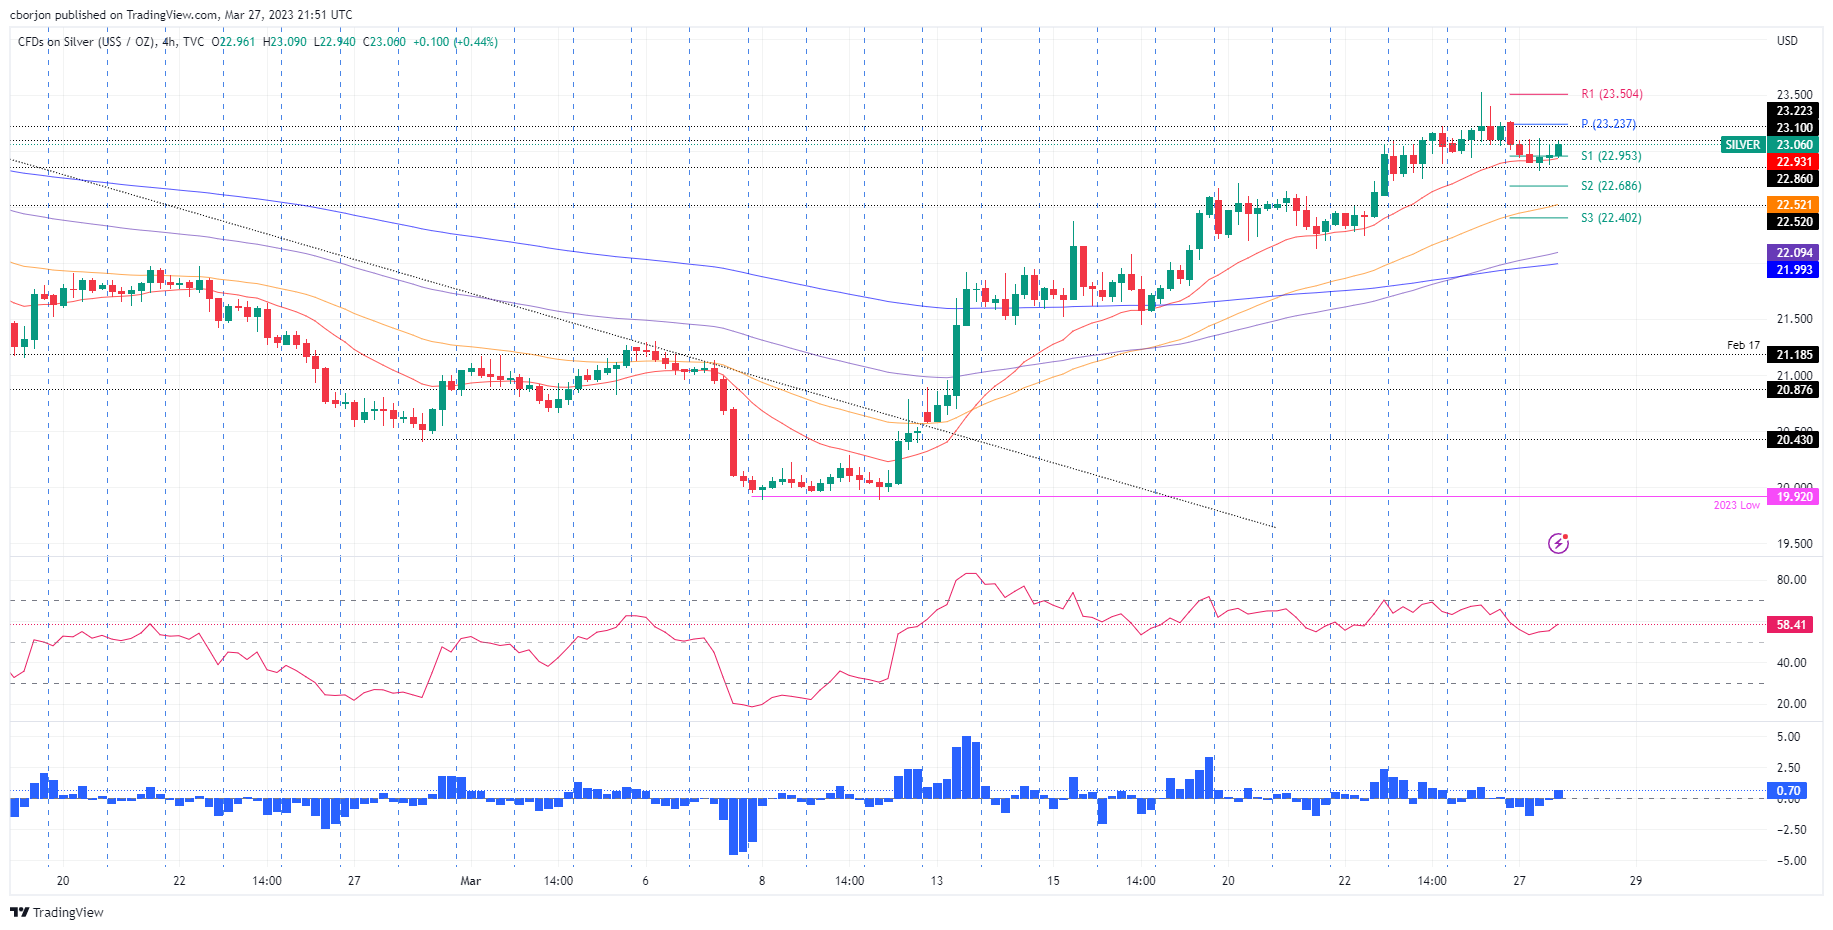
Short-term, the XAG/USD 4-hour chart indicates the pair is consolidating. The XAG/USD dipped toward the 20-EMA at $22.93, bouncing off and reclaiming the $23.00 figure. That, alongside the recent cross of the 100-EMA over the 200-EMA, could exacerbate a rally toward new YTD highs. Additionally, the Relative Strength Index (RSI) and the Rate of Change (RoC) shifted upwards.
Given the backdrop, the XAG/USD first resistance would be the March 27 high at $23.09. Once cleared, the white metal would be poised to test, the last week was high at $23.52 before challenging $24.00.
XAG/USD 4-hour chart
XAG/USD Technical levels