- Gold Price Forecast: XAU/USD sets for a breakdown below $1,950 as USD Index refreshes weekly high
Notícias do Mercado
Gold Price Forecast: XAU/USD sets for a breakdown below $1,950 as USD Index refreshes weekly high
- Gold price is likely to deliver a break below $1,950.00 amid rising hawkish Fed bets.
- The USD Index has printed a fresh weekly high above 103.00 as US inflation looks set for a rebound.
- Gold price has delivered a breakdown of the volatility contraction pattern.
Gold price (XAU/USD) is hovering near the edge of $1,950.00 after a sheer sell-off in the Asian session. The Gold price is expected to extend its losses as higher oil prices after OPEC+ decision of contracting production has renewed fears of a rebound in the United States inflation. Higher oil prices are likely to force factory owners to hike the prices of goods and services at factory gates, which will propel the Producer Price Index (PPI). Eventually, the US inflationary pressures would be fueled significantly.
The context of higher inflation expectations has infused fresh blood into the US Dollar Index (DXY). The USD Index has refreshed its weekly high above 103.00 as investors believe that the Federal Reserve (Fed) won’t have another alternative than to trigger rates higher. Fed Chair Jerome Powell might announce one more 25 basis points (bps) rate hike in May and will push rates above 5%.
Another catalyst that is weighing heavily on the Gold price is the easing of US banking jitters. Investors have digested the short-term panic produced after the collapse of three mid-size banks and hope that no further casualty will emerge ahead.
Meanwhile, S&P500 futures are failing to recover losses generated in the morning session as higher oil prices are likely to result in higher operating costs for oil-dependent firms. The alpha generated on 10-year Us Treasury yields has jumped above 3.52%.
Gold technical analysis
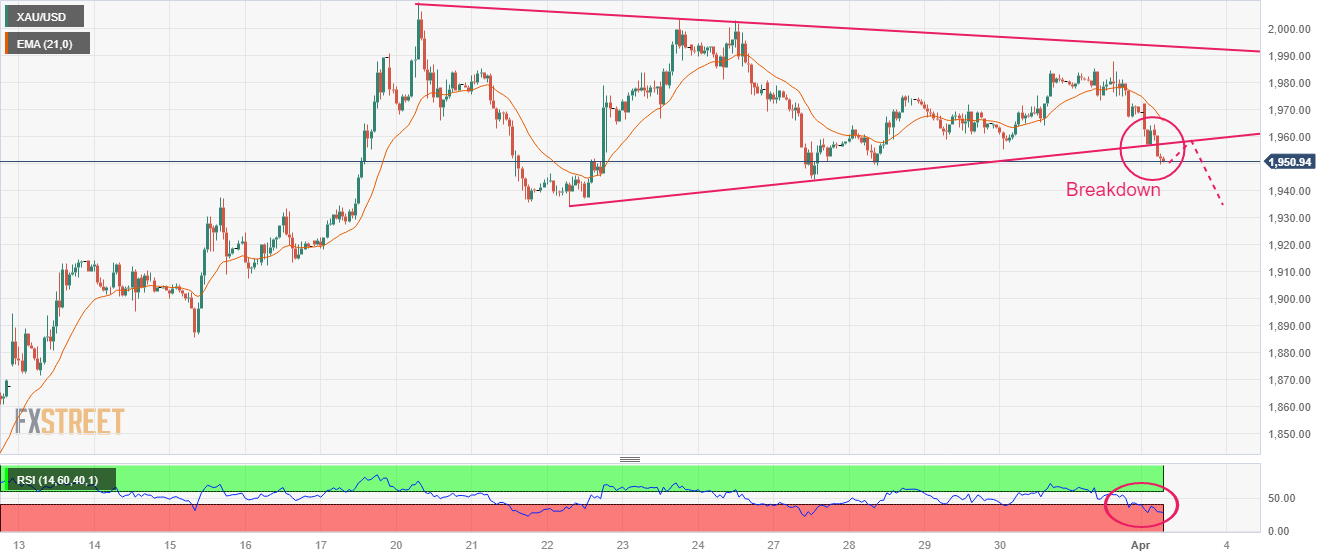
Gold price has delivered a breakdown of the Symmetrical Triangle chart pattern formed on an hourly scale. A breakdown of the aforementioned chart pattern results in wider ticks and heavy volatility as volatility gets exploded quickly.
The upward-sloping trendline of the Symmetrical Triangle plotted from the March 22 low at $1,934.34 will act as a major barricade for the Gold bulls.
The declining 21-period Exponential Moving Average (EMA) at $1,966.20 indicates more weakness ahead.
Adding to that, the Relative Strength Index (RSI) (14) has slipped into the bearish range of 20.00-40.00, which indicates that the downside momentum has been triggered.
Gold hourly chart