- USD/JPY Price Analysis: Retraces after failing to crack the 200-DMA
Notícias do Mercado
USD/JPY Price Analysis: Retraces after failing to crack the 200-DMA
- Bullish momentum faded after the USD/JPY could not break resistance at the 200-DMA.
- USD/JPY path of least resistance is downwards, with first support at 132.00.
- A fall beyond 132.00, and the USD/JPY could test 131.00.
USD/JPY retraces from two-week highs at around 133.75 and extends its losses below the 50-day Exponential Moving Average (EMA) at 133.25 after failing to pierce the 200-day EMA at 133.79. At the time of writing, the USD/JPY is exchanging hands at 132.28, down 0.33%.
USD/JPY Price action
From the daily chart perspective, the USD/JPY bullish momentum waned after the pair fell shy of cracking the 200-day EMA. That would’ve exposed the 134.00 figure on the upside, followed by the 100-day EMA at 134.25.
Hence, the USD/JPY resumed its downtrend direction, exacerbated by back-to-back breaks of essential support levels, like the 50 and 20-day EMAs, at 133.25 and 132.72. Additionally, the Relative Strength Index (RSI) failed to crack the 50-mid-line and headed downwards, while the Rate of Change (RoC) began to portray that sellers were gathering momentum.
Therefore, the USD/JPY path of least resistance is downwards. That said, the USD/JPY first support would be 132.00. A breach of the latter will expose the March 27 high at 131.76, followed by an upslope support trendline drawn from January lows that passes around 131.10-20. Once cleared, 131.00 would be next.
USD/JPY Daily chart
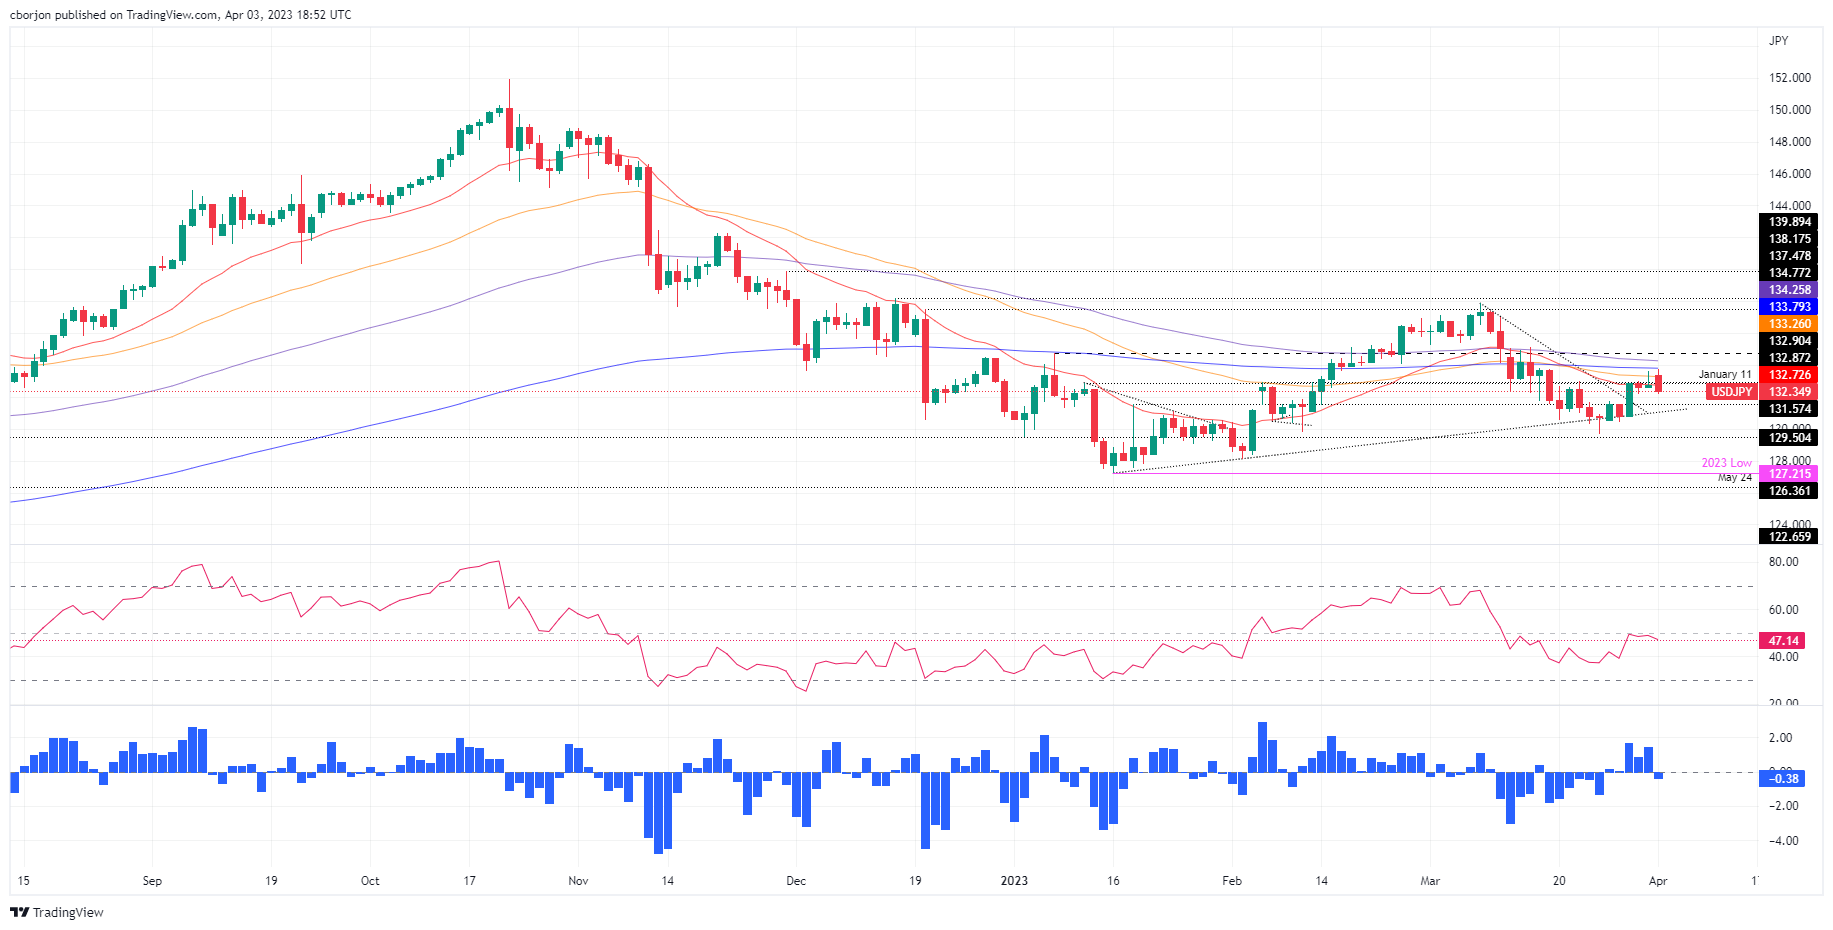
USD/JPY Technical levels