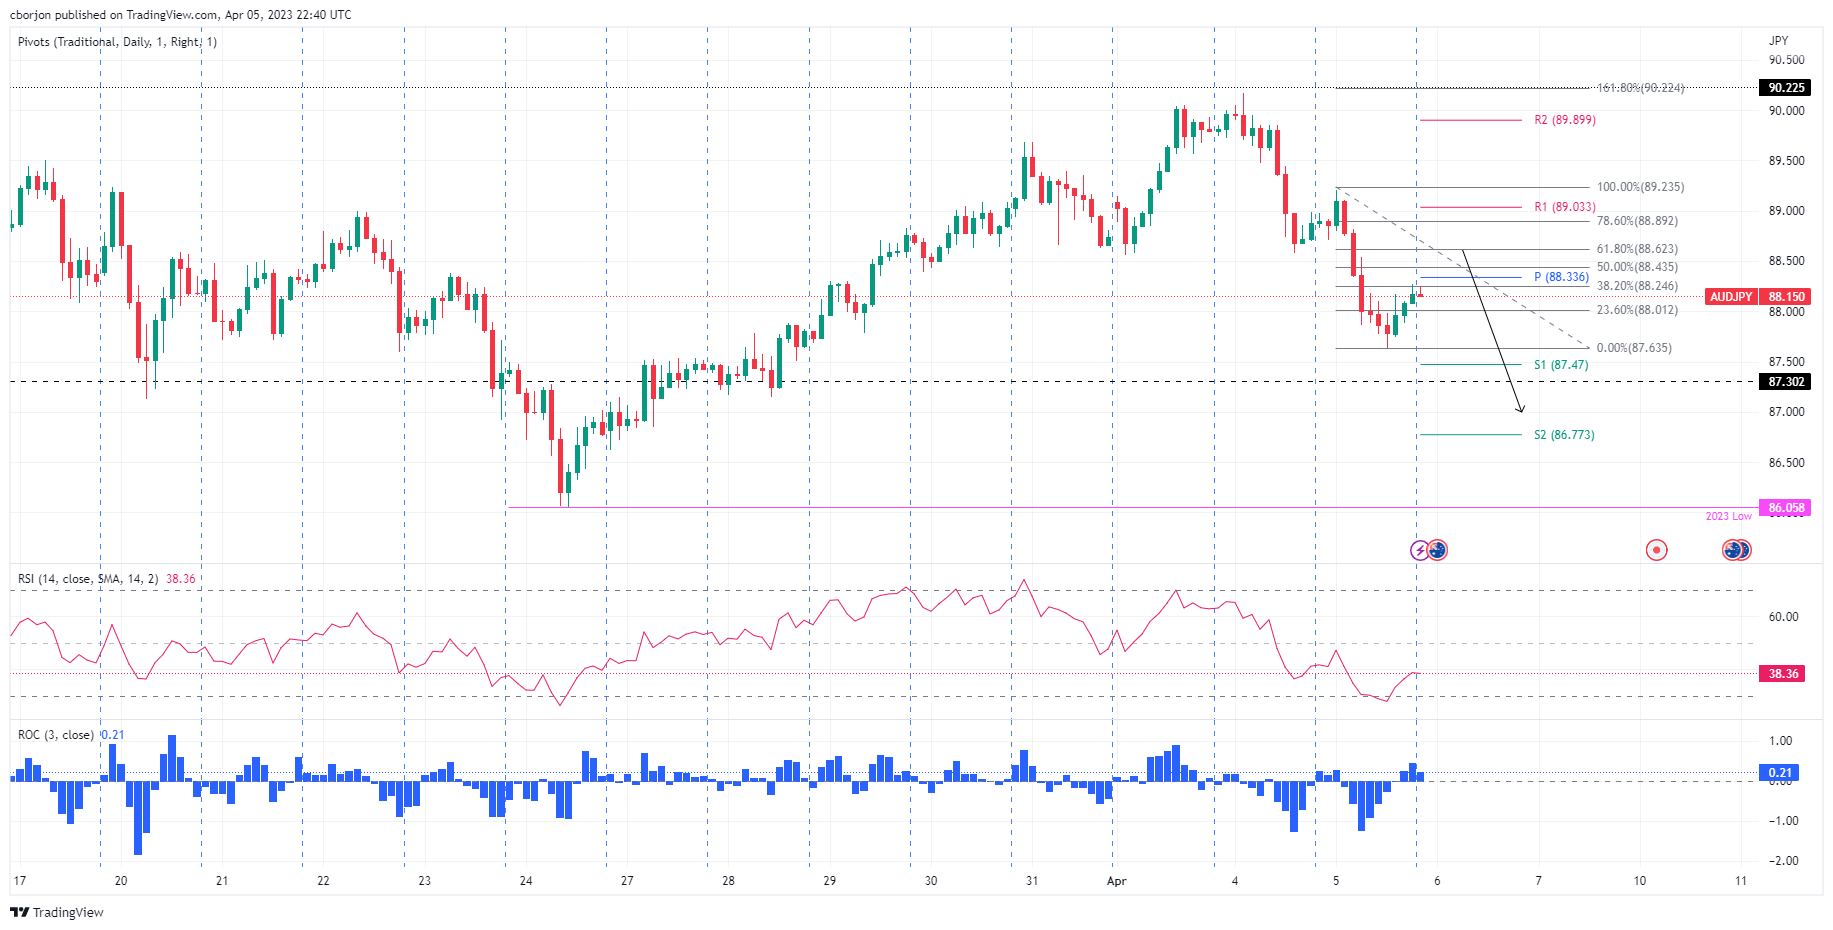
- AUD/JPY Price Analysis: Corrects upwards, but downside risks remain around 61.8 Fibonacci level
Notícias do Mercado
AUD/JPY Price Analysis: Corrects upwards, but downside risks remain around 61.8 Fibonacci level
- AUD/JPY pair sees two straight days of losses as sellers remain in charge.
- A breach of 20-day EMA support at 88.81 opens the path for further decline.
AUD/JPY Price Action
With the AUD/JPY pair extending its losses to two-straight days and breaching the 20-day Exponential Moving Average (EMA) support at 88.81 has opened the path for sellers. After testing previous resistance at around 90.00, where a prior support trendline turned resistance, sellers gathered momentum, and since then, the AUD/JPY has dropped 2.86%.
Oscillators remain in bearish territory, with the Relative Strength Index (RSI) aiming lower, while the Rate of Change (RoC) portrays sellers remaining in charge.
In the short term, the AUD/JPY 1-hour chart portrays the pair correcting upwards, testing the 38.2% Fibonacci retracement around 88.24. Upside risks lie at the central pivot point at 88.33, which, once cleared, would expose the R1 daily pivot at 89.03. Nevertheless, the confluence of April’s 5 low and the 61.80% Fibonacci retracement at around 88.62 would cap any rallies. If AUD/JPY retreats at the latter, look for a slide toward the S2 daily pivot point at 86.77.
AUD/JPY 1-Hour Chart

AUD/JPY Technical Levels