- Gold Price Forecast: XAU/USD signs last prayer above $1,990 as USD Index refreshes day high
Notícias do Mercado
Gold Price Forecast: XAU/USD signs last prayer above $1,990 as USD Index refreshes day high
- Gold price has stretched its downside to near $1,990.00 amid steep recovery in the USD Index.
- Investors are anticipating a rebound in US inflation figures amid solid labor market conditions.
- Gold price is declining towards the upward-sloping trendline plotted at $1,885.77.
Gold price (XAU/USD) has extended its downside to near $1,990.00 as the US Dollar Index (DXY) has refreshed the day’s high amid soaring anxiety among the market participants ahead of the release of the United States inflation data. The USD Index has printed a fresh high of 102.23 as investors are anticipating a rebound in US inflation figures amid solid labor market conditions.
Meanwhile, S&P500 futures have extended their losses on hopes that the Federal Reserve (Fed) is looking to hike rates further to arrest persistent inflation, portraying a decline in the risk appetite of the market participants. Fed chair Jerome Powell is expected to push rates above 5% as the Unemployment Rate has further dropped. This might continue to force firms to offer higher earnings for acquiring fresh talent.
Contrary to the USD Index, the US Treasury yields have faced pressure. The 10-year US Treasury yields have dropped to near 3.37%.
For further guidance, Wednesday’s US inflation data will be keenly watched. Moderation in the headline Consumer Price Index (CPI) is highly expected as gas prices remained lower in March due to weak oil prices. The core inflation that excludes oil and gas prices is expected to show a surprise upside as average earnings by households are highly solid.
Gold technical analysis
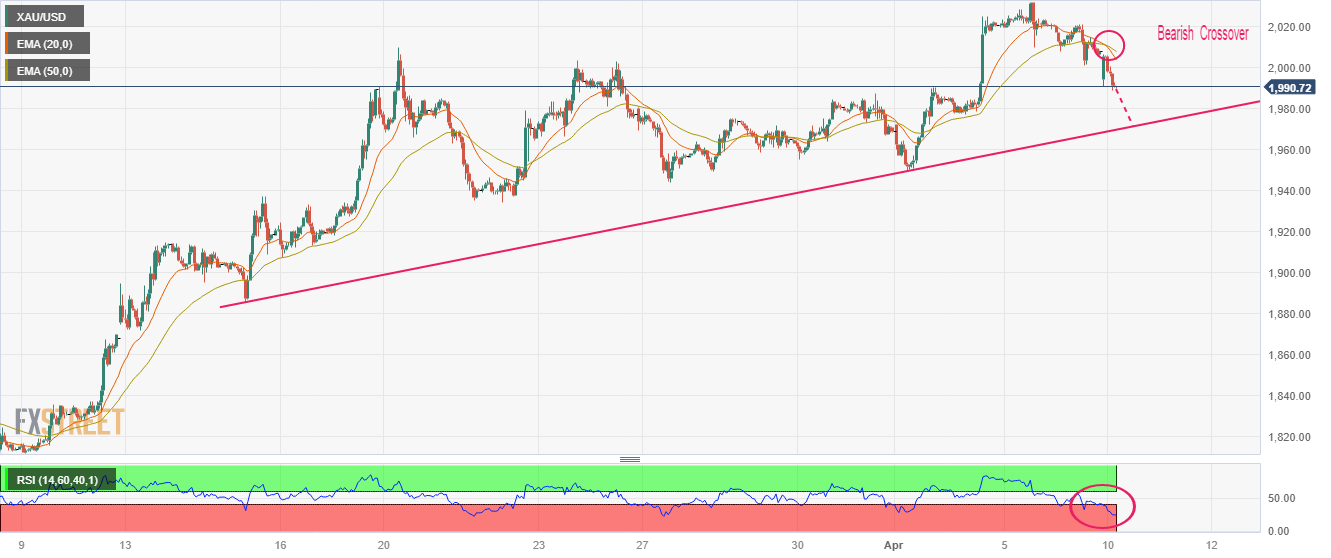
Gold price is declining towards the upward-sloping trendline plotted from March 15 low at $1,885.77 on an hourly scale. The precious metal has surrendered the psychological support of $2,000.00.
A bear cross, represented by the 20-and 50-period Exponential Moving Averages (EMAs) at $2,011.43, indicates more weakness ahead.
Meanwhile, the Relative Strength Index (RSI) (14) has slipped into the bearish range of 20.00-40.00, which conveys that the downside momentum is in action.
Gold hourly chart