- Gold Price Forecast: XAU/USD reaches near $2,000 after recovery as investors ignore hawkish Fed bets
Notícias do Mercado
Gold Price Forecast: XAU/USD reaches near $2,000 after recovery as investors ignore hawkish Fed bets
- Gold price has scaled to near $2,000.00 amid further correction in the USD Index.
- S&P500 futures have added some gains in Asia, portraying improved risk appetite.
- Gold price has managed to surpass the 20-EMA, which indicates that the short-term trend has turned bullish.
Gold price (XAU/USD) has taken its recovery to near the psychological resistance of $2,000.00 in the Asian session. The precious metal has regained traction as investors have ignored hawkish Federal Reserve (Fed) bets fueled after the release of United States Employment data last week.
The street seems convinced about one more 25 basis points (bps) rate hike from the Fed as the US inflation is expected to remain stubborn amid upbeat demand for labor. More than 70% of investors are anticipating a rate hike of 25 bps, which will push rates to 5.00-5.25%, according to the CME Fedwatch tool.
Meanwhile, S&P500 futures have added some gains in Asia, portraying improved risk appetite of the market participants. US equities recovered dramatically on Monday after a gap-down opening due to higher volatility inspired by the extended weekend.
The US Dollar Index (DXY) is working on defending its immediate support of 102.30 after a sheer contraction. Also, 10-year US Treasury yields have dropped below 3.41%.
For further guidance, US Inflation data will be keenly watched. As per the consensus, the headline inflation will soften to 5.2% from the former release of 6.0%. Also, monthly headline CPI would decelerate to 0.3% from 0.4% reported earlier. While annual core inflation that excludes oil and food prices could surprisingly jump to 5.6% from the former release of 5.5%. Headline inflation is expected to soften due to weaker oil prices recorded in March.
Gold technical analysis
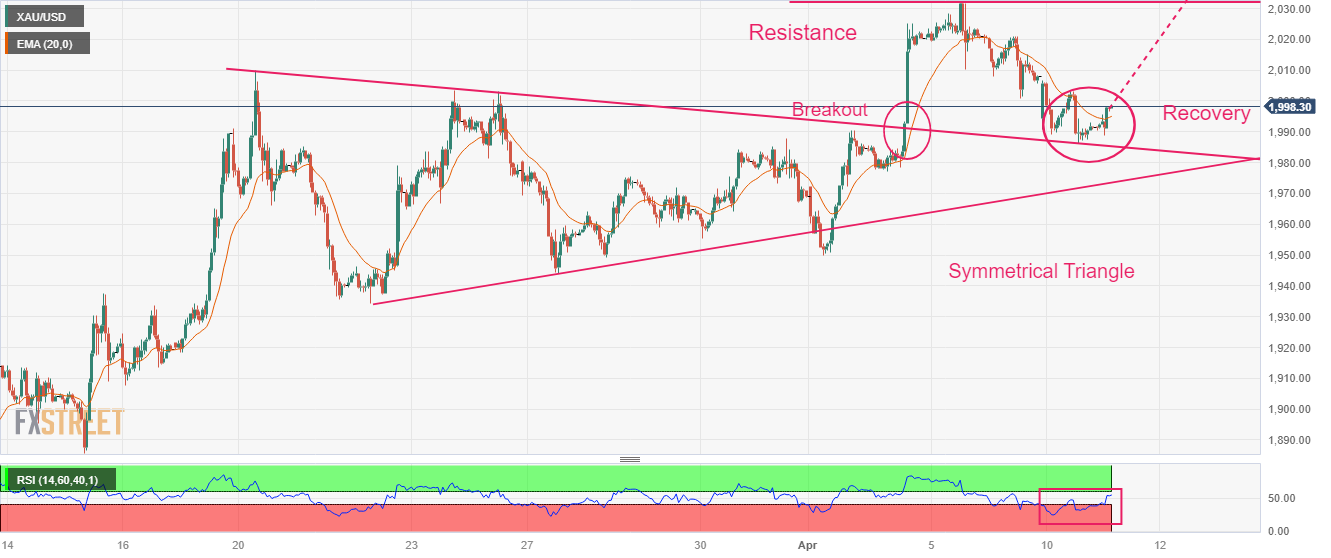
Gold price has shown a decent recovery after testing the breakout region of the Symmetrical Triangle chart pattern formed on an hourly scale. The precious metal is marching towards the horizontal resistance plotted from April 05 high at $2,032.00.
Gold price has managed to surpass the 20-period Exponential Moving Average (EMA) at $1,995.00, which indicates that the short-term trend has turned bullish.
Also, the Relative Strength Index (RSI) (14) has rebounded after dropping below 40.00, which indicates the presence of responsive buyers.
Gold hourly chart