- Natural Gas Price Analysis: XNG/USD approaches $2.23 hurdle on bullish RSI divergence
Notícias do Mercado
Natural Gas Price Analysis: XNG/USD approaches $2.23 hurdle on bullish RSI divergence
- Natural Gas price picks up bids to refresh intraday high, snaps two-day downtrend.
- Higher low of XNG/USD price contradicts with lower lows of RSI to suggest further recovery.
- Immediate resistance line holds the key to further upside, weekly top prods Natural Gas buyers.
- XNG/USD bears need validation from $2.12 to retake control.
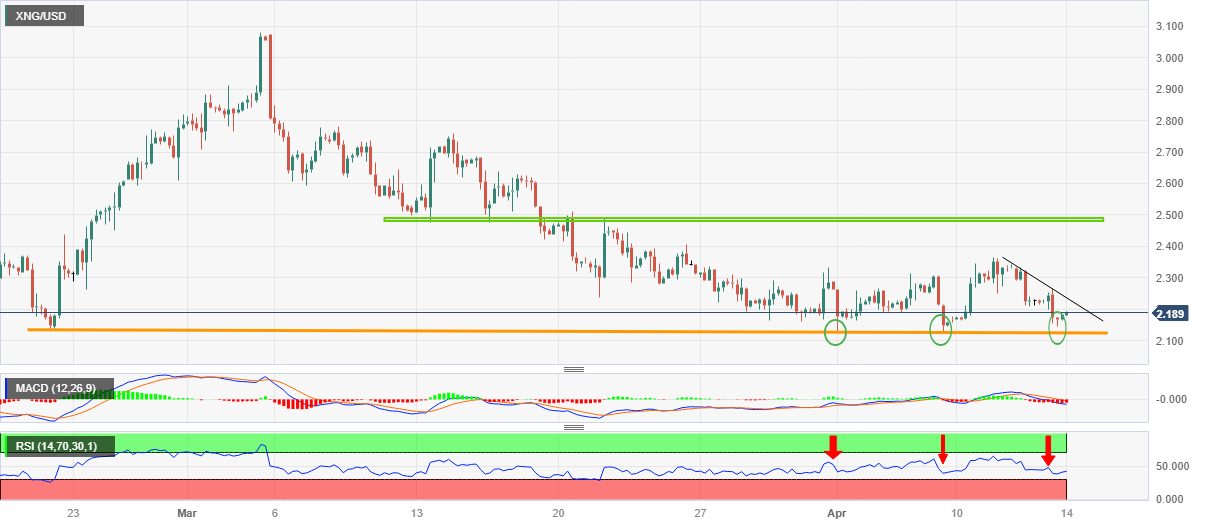
Natural Gas (XNG/USD) price renews intraday high near $2.20 as the energy instrument defies the previous two-day losing streak during early Friday. In doing so, the XNG/USD justifies hidden bullish RSI (14) divergence on the four-hour chart.
That said, Natural Gas price printed higher lows in the last two weeks but the RSI conditions commensurate to these troughs remain contradicting as the RSI (14) line marks a lower low. As a result, the price momentum towards the upside seems to gain acceptance and hence the XNG/USD buyers can expect more recovery.
However, a downward-sloping resistance line from Tuesday, near $2.23 by the press time, guards the quote’s immediate upside ahead of the weekly top surrounding $2.36.
Following that, a one-month-old horizontal resistance area surrounding $2.47-50 will be a tough nut to crack for the Natural Gas buyers before retaking the command.
Alternatively, pullback moves remain elusive unless the XNG/USD stays beyond an ascending support line stretched from late February, around $2.12 at the latest.
Even so, the $2.00 psychological magnet can challenge the Natural Gas bears before directing them to the July 2020 high of around $1.96.
XNG/USD: Four-hour chart

Trend: Further recovery expected