- Gold Price Forecast: $2,050 prods XAU/USD bulls on the way to refresh all-time high – Confluence Detector
Notícias do Mercado
Gold Price Forecast: $2,050 prods XAU/USD bulls on the way to refresh all-time high – Confluence Detector
- Gold price seesaws within a choppy range after refreshing 13-month high.
- XAU/USD bulls keep the reins as downbeat US inflation clues tease Fed policy pivot and weigh on US Dollar.
- More proof of easing US inflation eyed as Gold buyers take a breather.
Gold price (XAU/USD) seesaws within a $15 trading range after refreshing the 13-month high with the $2,049 mark. Even so, the yellow metal remains well set for a four-day uptrend, as well as bracing for the second consecutive weekly high, amid broad-based US Dollar weakness. That said, the greenback bears the burden of the easing hawkish Fed bets, backed by softer inflation numbers. Also weighing on the US Dollar could be the looming threat to its reserve currency status.
Apart from the US Dollar Index (DXY) fall to a fresh one-year low, hopes of faster growth in Asia, one of the major Gold consumers, as well as fears of recession depicted by downbeat yields, also propel the XAU/USD prices.
Moving on, US Retail Sales for March, the Michigan Consumer Sentiment Index (CSI) for April and the University of Michigan’s (UoM) 5-year Consumer Inflation Expectations will be important to watch for clear directions for the Gold traders.
Considering the aforementioned catalysts, the Gold bulls are likely to keep the reins unless the scheduled data provide a major positive surprise. Even if the mentioned statistics rally, a light calendar in the next week, except for the Purchasing Managers Indexes (PMIs), may restrict the corrective pullback in the Gold Price.
Also read: Gold Price Forecast: XAU/USD eyes a pullback before resuming journey toward $2,075
Gold Price: Key levels to watch
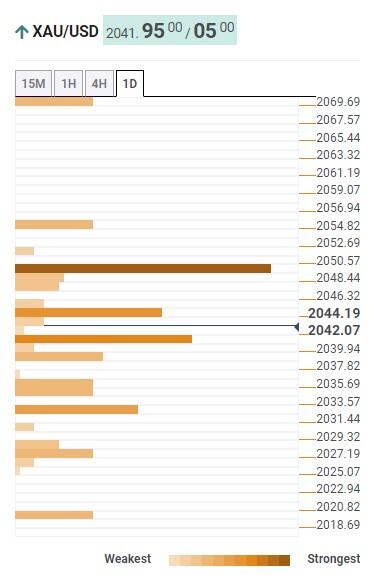
Our Technical Confluence indicator highlights $2,050 as the key upside hurdle for the Gold price to cross to challenge the previous multi-month peaks of the XAU/USD. That said, the stated level comprises Pivot Point one-month R1 and the previous daily high.
Also acting as an immediate upside hurdle is the Pivot Point one-day R1 near $2,050.
Following that, a jump towards the Pivot Point one day R2 level around $2,070, also encompassing the previous yearly high, can’t be ruled out. However, the current all-time peak of around $2,075, marked in 2020, may challenge the Gold price upside afterward.
Meanwhile, a convergence of the Fibonacci 23.6% and upper Bollinger bank on one day, around $2,040, put a floor under the Gold price.
In a case where the Gold price remains weak past $2,040, the previous weekly high close to $2,033 may test the XAU/USD sellers.
It’s worth noting that Fibonacci 61.8% on one day around $2,027 and Pivot Point one day S1, close to $2,020, may act as the last defense of the Gold buyers before highlighting the $2,000 psychological magnet.
Here is how it looks on the tool
About Technical Confluences Detector
The TCD (Technical Confluences Detector) is a tool to locate and point out those price levels where there is a congestion of indicators, moving averages, Fibonacci levels, Pivot Points, etc. If you are a short-term trader, you will find entry points for counter-trend strategies and hunt a few points at a time. If you are a medium-to-long-term trader, this tool will allow you to know in advance the price levels where a medium-to-long-term trend may stop and rest, where to unwind positions, or where to increase your position size.