- Breaking: China data dump: GDP beat by 0.5% vs expectations, Retail Sales, big beat 10.6% vs 7.4%
Notícias do Mercado
Breaking: China data dump: GDP beat by 0.5% vs expectations, Retail Sales, big beat 10.6% vs 7.4%
China released a series of red data on Tuesday as follows:
Gross Domestic Product (GDP)
- Chinese GDP (YoY) Q1: 4.5% (expected 4.0%; previous 2.9%).
Industrial Production
- Chinese Industrial Production (YoY) Mar: 3.9% (expected 4.4%; previous 2.4%).
Retail Sales
- Chinese Retail Sales (YoY) Mar: 10.6% (exp 7.5%; previous 3.5%).
- Retail Sales YTD (YoY) Mar: 5.8% (exp 3.7%; previous 3.5%).
AUD/USD update
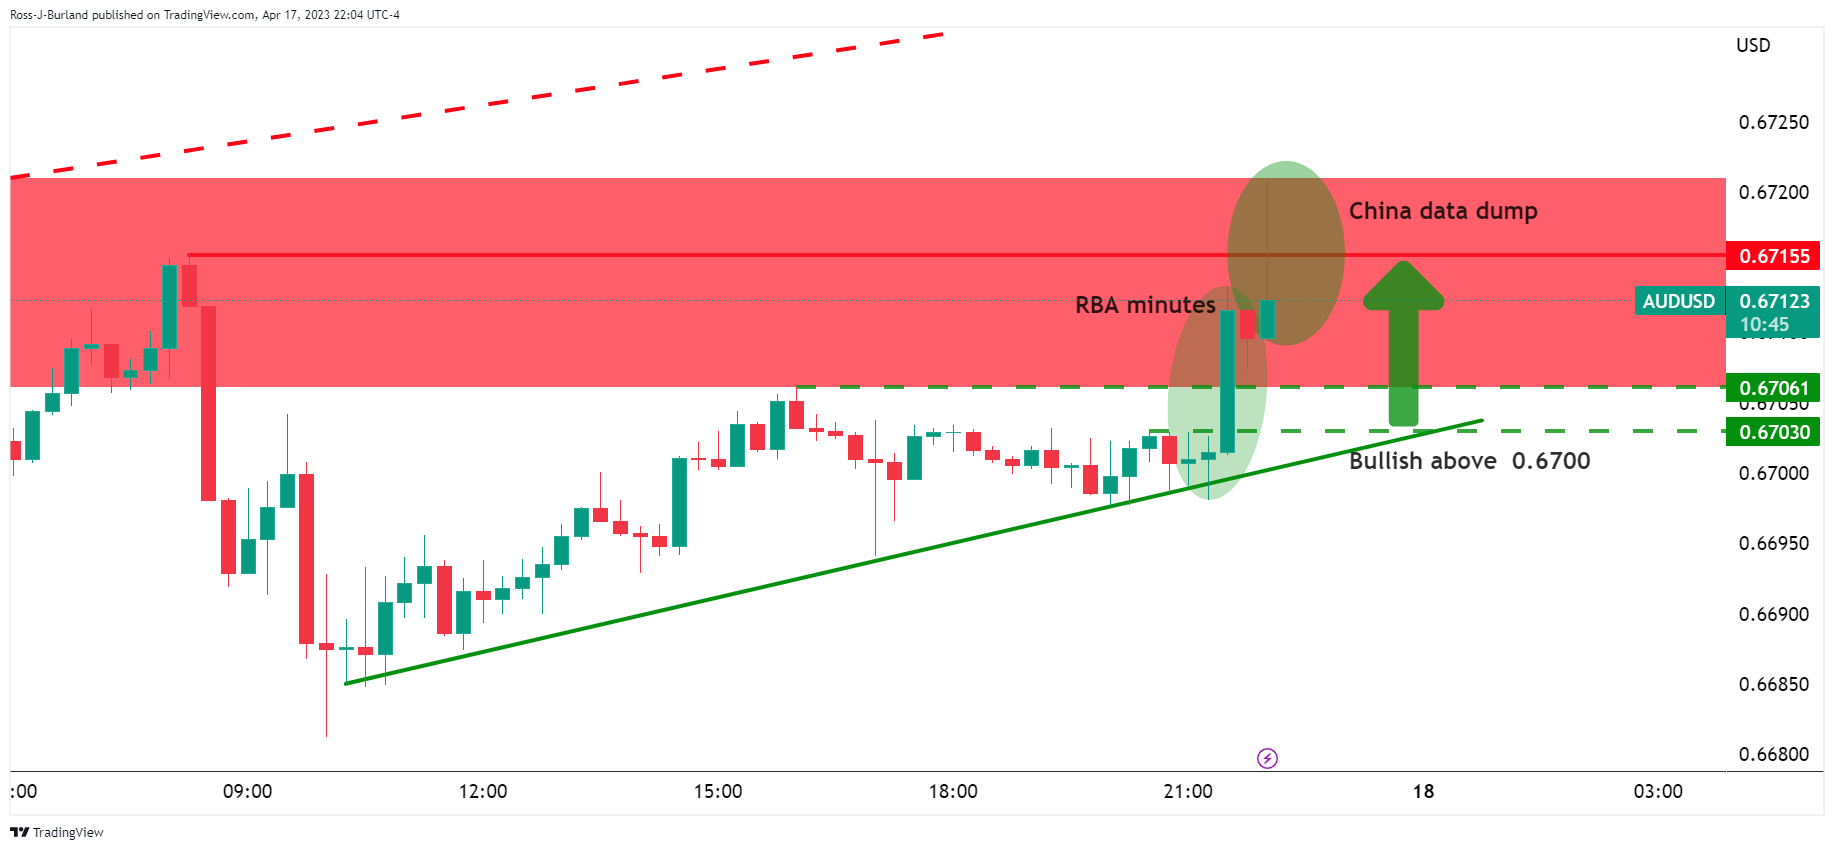
AUD/USD has rallied on two accounts, one being the Reserve Bank of Australia minutes and then the Chinese data dump.
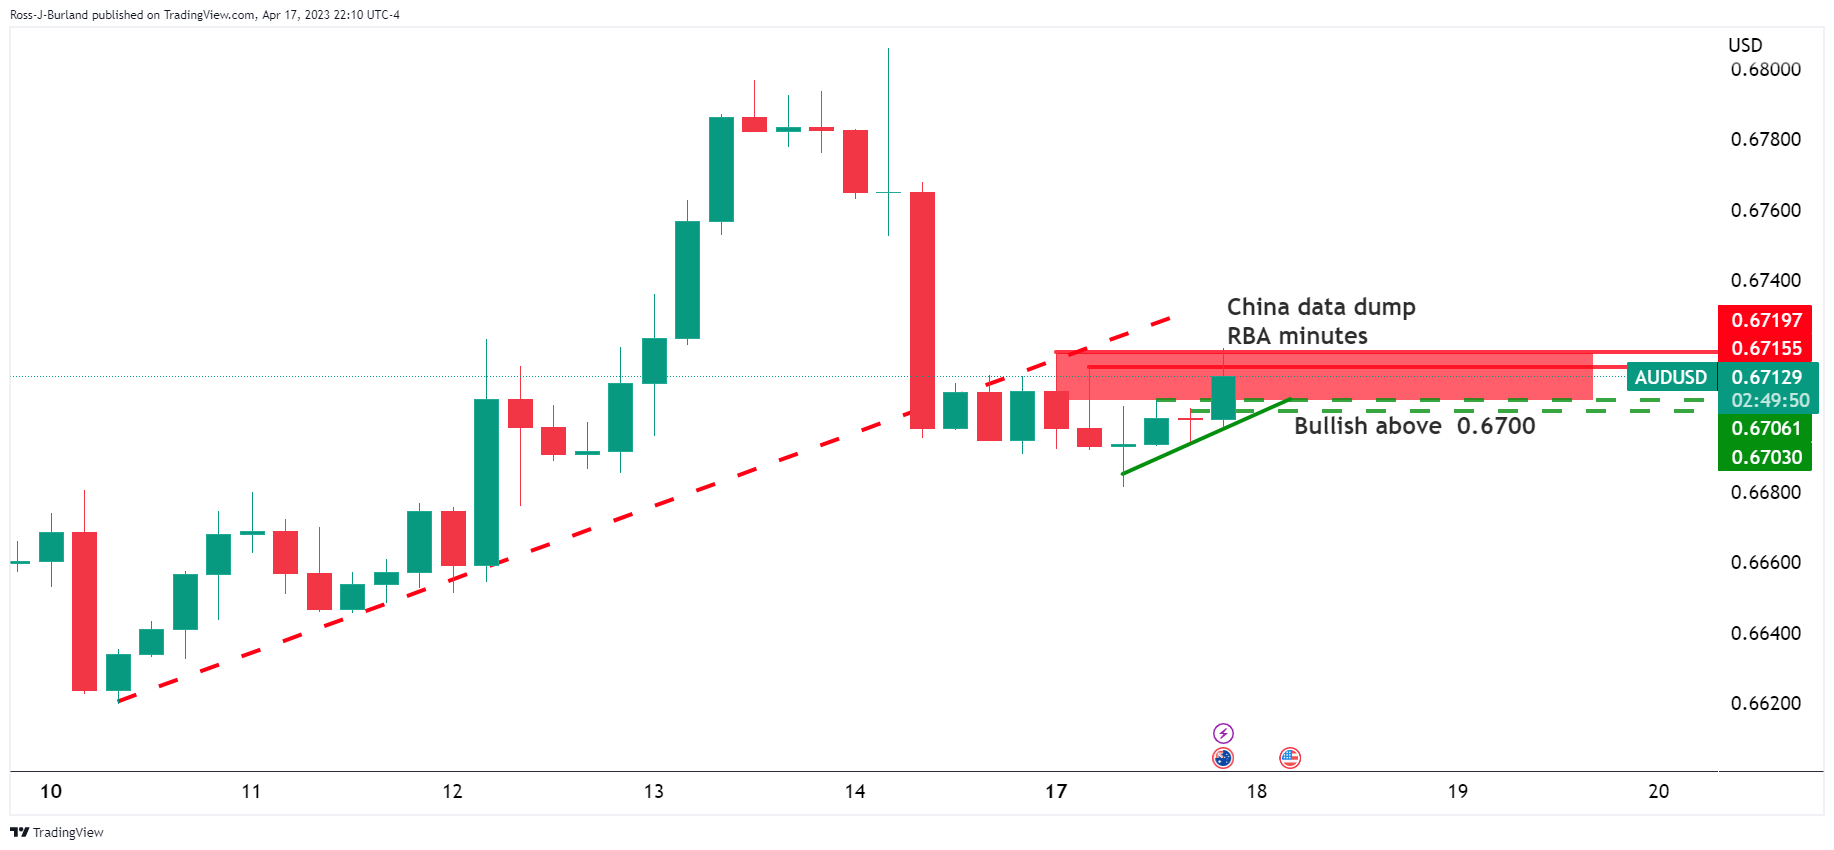
The 4-hour chart sees the price testing the sideways channel´s highs near 0.6720 but with being on the backside of the prior bullish trend, bulls have a lot of work to do to take back control.
About the data
The Gross Domestic Product (GDP) released by the National Bureau of Statistics of China studies the gross value of all goods and services produced by China. The indicator presents the pace at which the Chinese economy is growing or decreasing. As the Chinese economy has influence on the global economy, this economic event would have an impact on the Forex market. Generally speaking, a high reading is seen as positive (or bullish) for the CNY, while a low reading is seen as negative (or Bearish).
Industrial output is released by the National Bureau of Statistics of China. It shows the volume of production of Chinese Industries such as factories and manufacturing facilities. A surge in output is regarded as inflationary which would prompt the People’s Bank of China would tighten monetary policy and fiscal policy risk. Generally speaking, if high industrial production growth comes out, this may generate a positive sentiment (or bullish) for the CNY, whereas a low reading is seen as negative (or Bearish) for the CNY.
The Retail Sales report released by the National Bureau of Statistics of China measures the total receipts of the retailed consumer goods. It reflects the total consumer goods that the various industries supply to the households and social groups through various channels. It is an important indicator to study the changes in the Chinese retail market and reflecting the degree of economic prosperity. In general, A high reading is seen as positive (or bullish) CNY, while a low reading is seen as negative (or bearish) for the CNY.