- AUD/USD Price Analysis: Stretches recovery to near 0.6740 ahead of PBoC’s decision
Notícias do Mercado
AUD/USD Price Analysis: Stretches recovery to near 0.6740 ahead of PBoC’s decision
- AUD/USD has shown a recovery move amid a soft performance by the USD Index.
- The RBA minutes showed that policymakers were actively discussing a rate hike but concluded the meeting with steady interest rates.
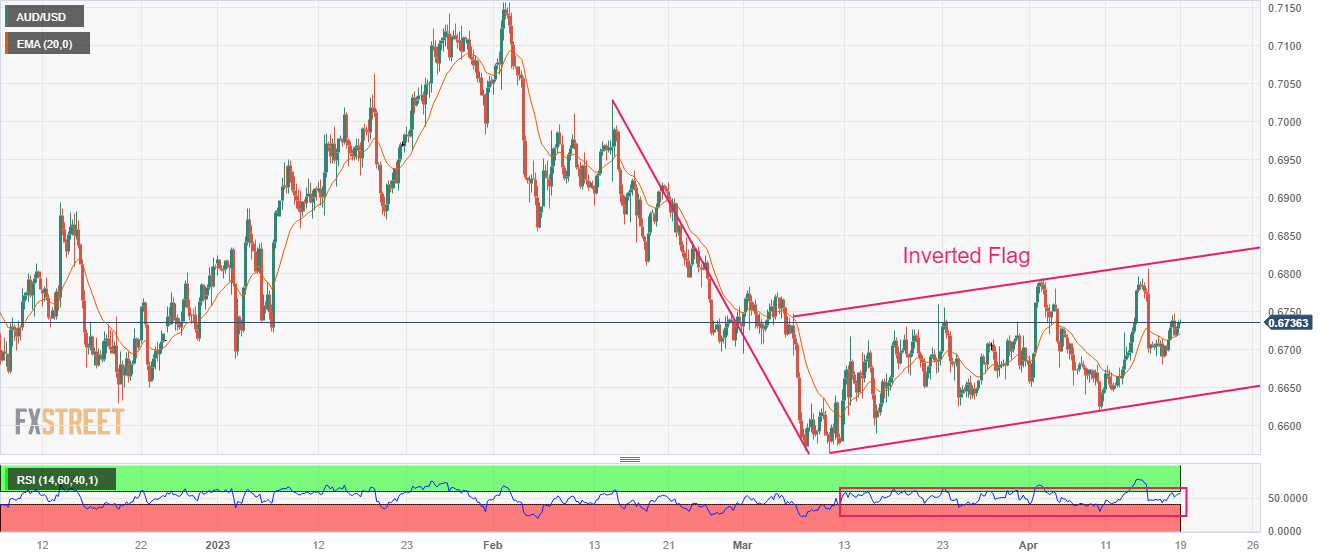
- AUD/USD is auctioning in an Inverted Flag that displays a long consolidation and is followed by a breakdown.
The AUD/USD pair has rebounded firmly to near 0.6740 after a gradual correction. The Aussie asset witnessed stellar buying interest amid the soft US Dollar and an upside revision in forecast for China’s growth rate. The US Dollar Index (DXY) is showing a quiet action ahead of the release of the Federal Reserve’s (Fed) Beige Book.
The Australian Dollar remained in action on Tuesday after the release of the Reserve Bank of Australia (RBA) minutes. The RBA minutes showed that policymakers were actively discussing a rate hike but concluded the meeting with a decision of keeping rates steady at 3.6%. RBA Governor Philip Lowe cited that the central bank needs some time to gather information for further action.
Forecasting agencies were gung ho for raising China’s Gross Domestic Product (GDP) forecast after an upbeat quarterly performance. Going forward, the interest rate decision by the People’s Bank of China (PBoC) will be the key highlight. It is worth noting that Australia is the leading trading partner of China and upbeat Chinese prospects would support the Australian Dollar.
AUD/USD is auctioning in an Inverted Flag chart pattern on an hourly scale. An Inverted Flag is a trend-following pattern which displays a long consolidation that is followed by a breakdown. Usually, the consolidation phase of the chart pattern serves as an inventory adjustment in which those participants initiate shorts, which prefer to enter an auction after the establishment of a bearish bias and current sellers add more positions.
The 20-period Exponential Moving Average (EMA) at 0.6720 is overlapping the asset price, indicating a lackluster performance.
Meanwhile, the Relative Strength Index (RSI) (14) is hovering in the 40.00-60.00 range, signaling an absence of a potential trigger.
Going forward, a break above March 22 high at 0.6759 will drive the asset toward April 03 high at 0.6693. A breach above the latter would further drive the asset to February 06 low at 0.6855.
In an alternative scenario, more weakness will be observed on a breakdown of April 10 low at 0.6620, which will expose the Aussie asset to March 10 low at 0.6564 followed by the round-level support at 0.6500.
AUD/USD four-hour chart