- Gold Price Forecast: XAU/USD remains sideways below $2,000 ahead of preliminary US S&P PMI data
Notícias do Mercado
Gold Price Forecast: XAU/USD remains sideways below $2,000 ahead of preliminary US S&P PMI data
- Gold price is in a sideways trend as the USD Index has shifted into a volatility contraction mode.
- The street is anticipating that tight credit conditions would affect the working capital management of cash-reliant firms.
- Banks have tightened conditions for disbursing credit to avoid deterioration of asset quality.
Gold price (XAU/USD) is displaying topsy-turvy moves around $1,994.00 in the early European session. The precious metal is in a directionless mode as investors are awaiting the release of preliminary United States S&P PMI data, which is scheduled for Friday.
The US Dollar Index (DXY) is demonstrating signs of volatility contraction below 102.00 after wild moves influenced by Federal Reserve’s (Fed) Beige Book. Economic activities in 12 Fed districts remained almost constant, however, the catalyst that has deepened fears of a recession in the US economy is the declining trend of advances to consumer and business loans by US commercial banks. Banks have tightened conditions for disbursing credit to avoid deterioration of asset quality.
Meanwhile, S&P futures have registered decent losses in the Asian session as investors are cautious over commentary from firms over revenue guidance. The street is anticipating that tight credit conditions would affect the working capital management of cash-reliant firms, which would impact their workflow.
Considering the event of preliminary US S&P PMI data, the street is anticipating Manufacturing PMI at 49.0, lower than the former release of 49.2. The Services PMI is also seen lower at 51.5 against the figure of 52.6 released earlier.
Gold technical analysis
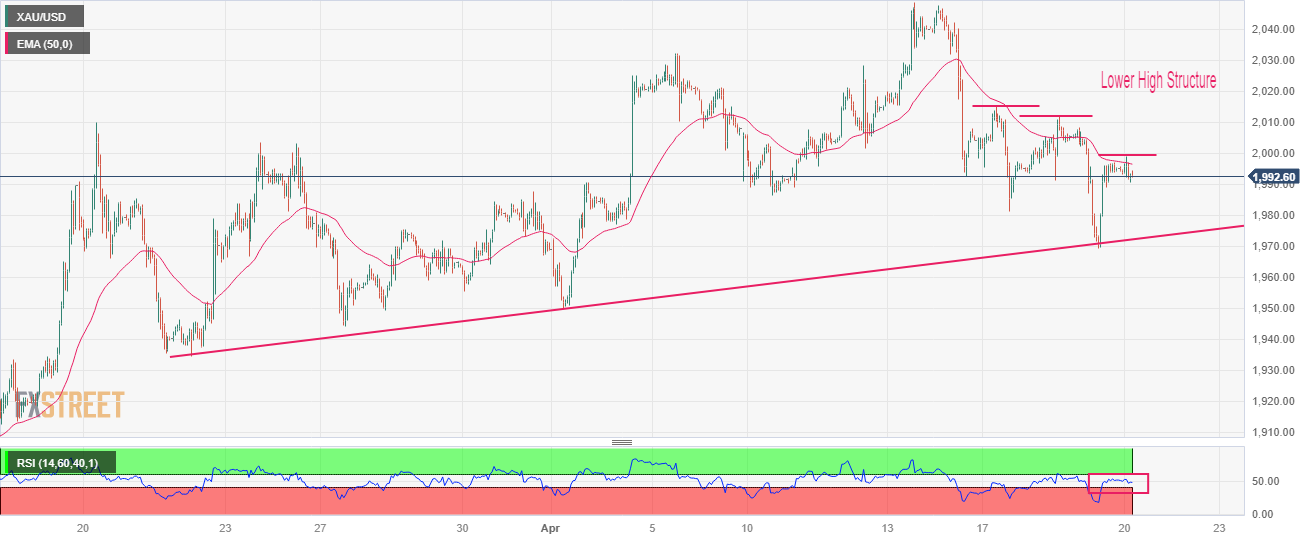
Investors are divided over the further direction in the Gold price as the upward-sloping trendline from March 24 low at $1,934.34 is supporting the downside. While the lower highs structure has not vanished yet despite a firmer recovery move.
The 50-period Exponential Moving Average (EMA) at $1,996.50 is acting as a barricade for the Gold bulls.
Meanwhile, the Relative Strength Index (RSI) (14) is oscillating in the 40.00-60.00 range, indicating a lackluster performance ahead.
Gold hourly chart