- USD/JPY Price Analysis: Bears lurking near 134.50 for a downside correction
Notícias do Mercado
USD/JPY Price Analysis: Bears lurking near 134.50 for a downside correction
- USD/JPY is carving out the prospects of a deeper correction.
- The bullish bias prevails while on the front side of the broader bullish trendline.
USD/JPY is down 0.26%, losing ground in late New York trade within the day´s range of 134.01 the earlier low and last Asian high of 134.97.
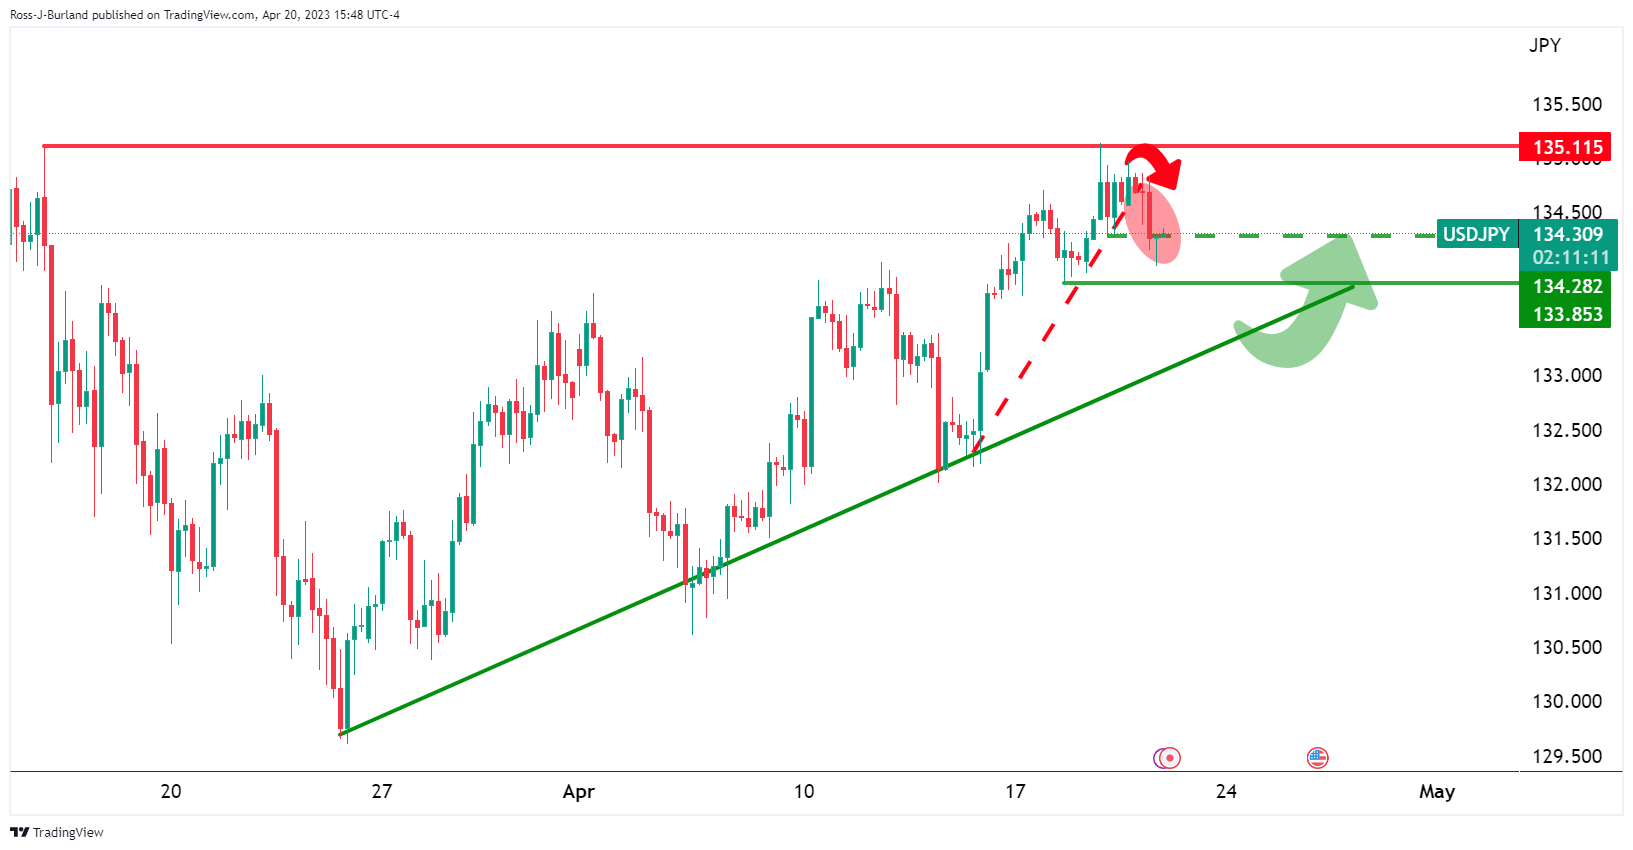
As per the prior analysis, USD/JPY Price Analysis: Bulls move in to test bears near 135.00, the price moved into the resistance and bulls threw in the towel and a break of structure leaves the focus on a fuller correction to the downside as the following illustrates:
USD/JPY, prior analysis
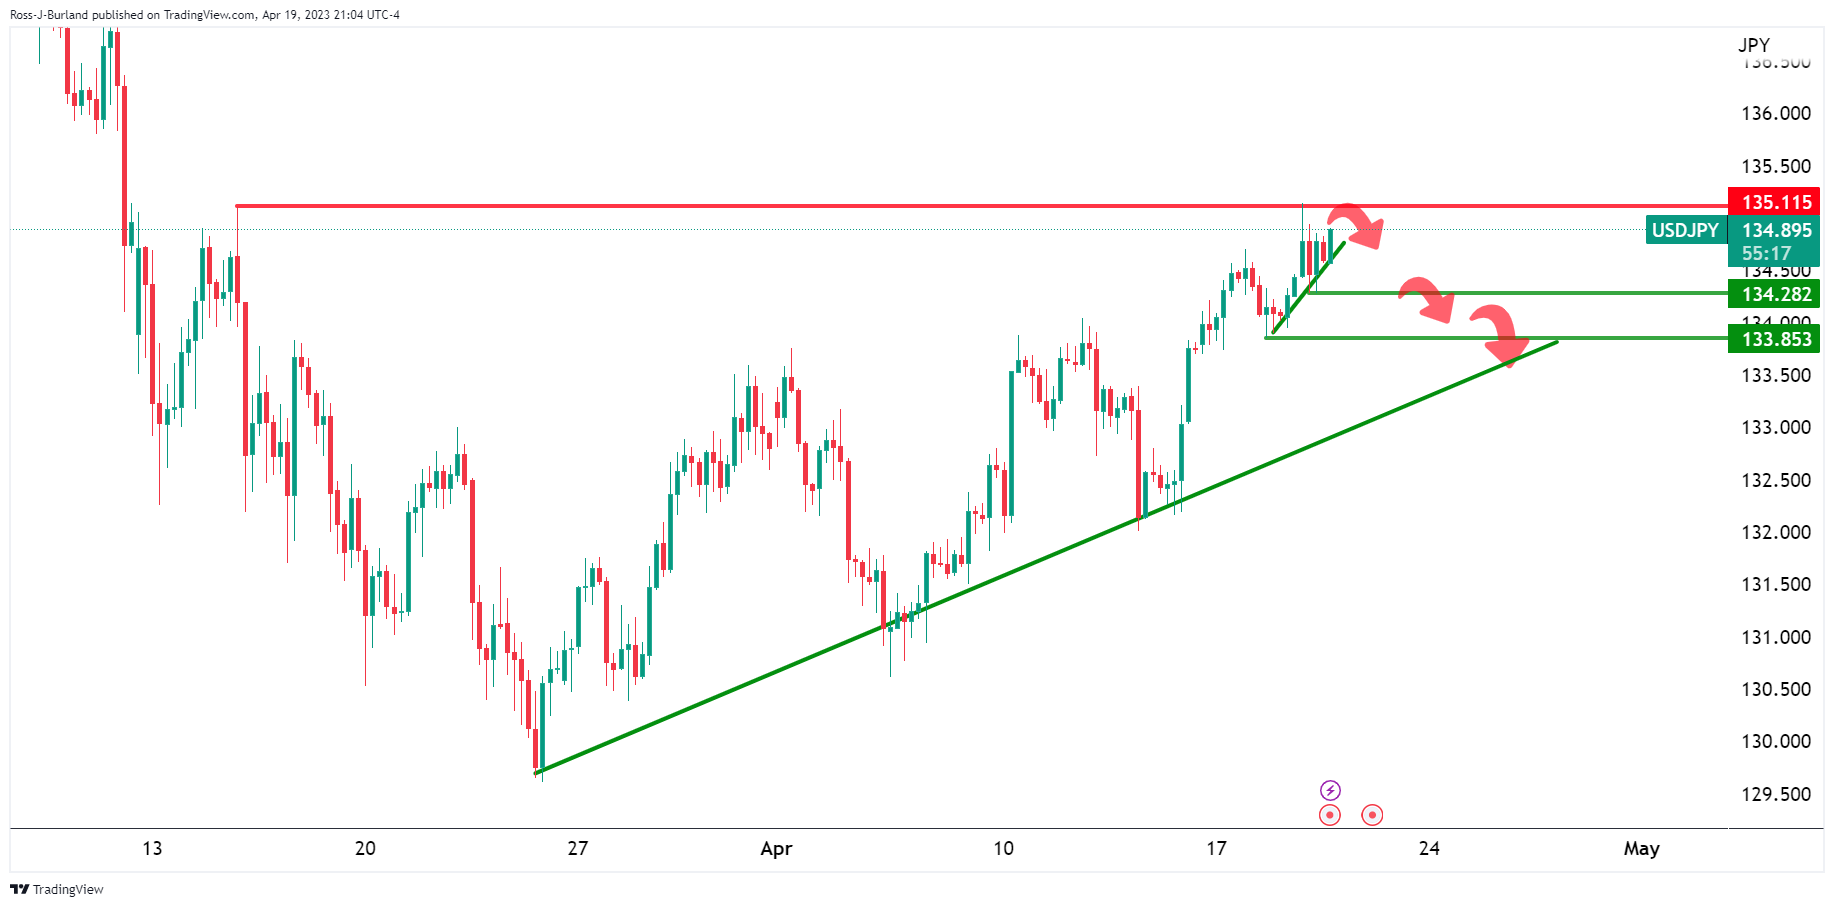
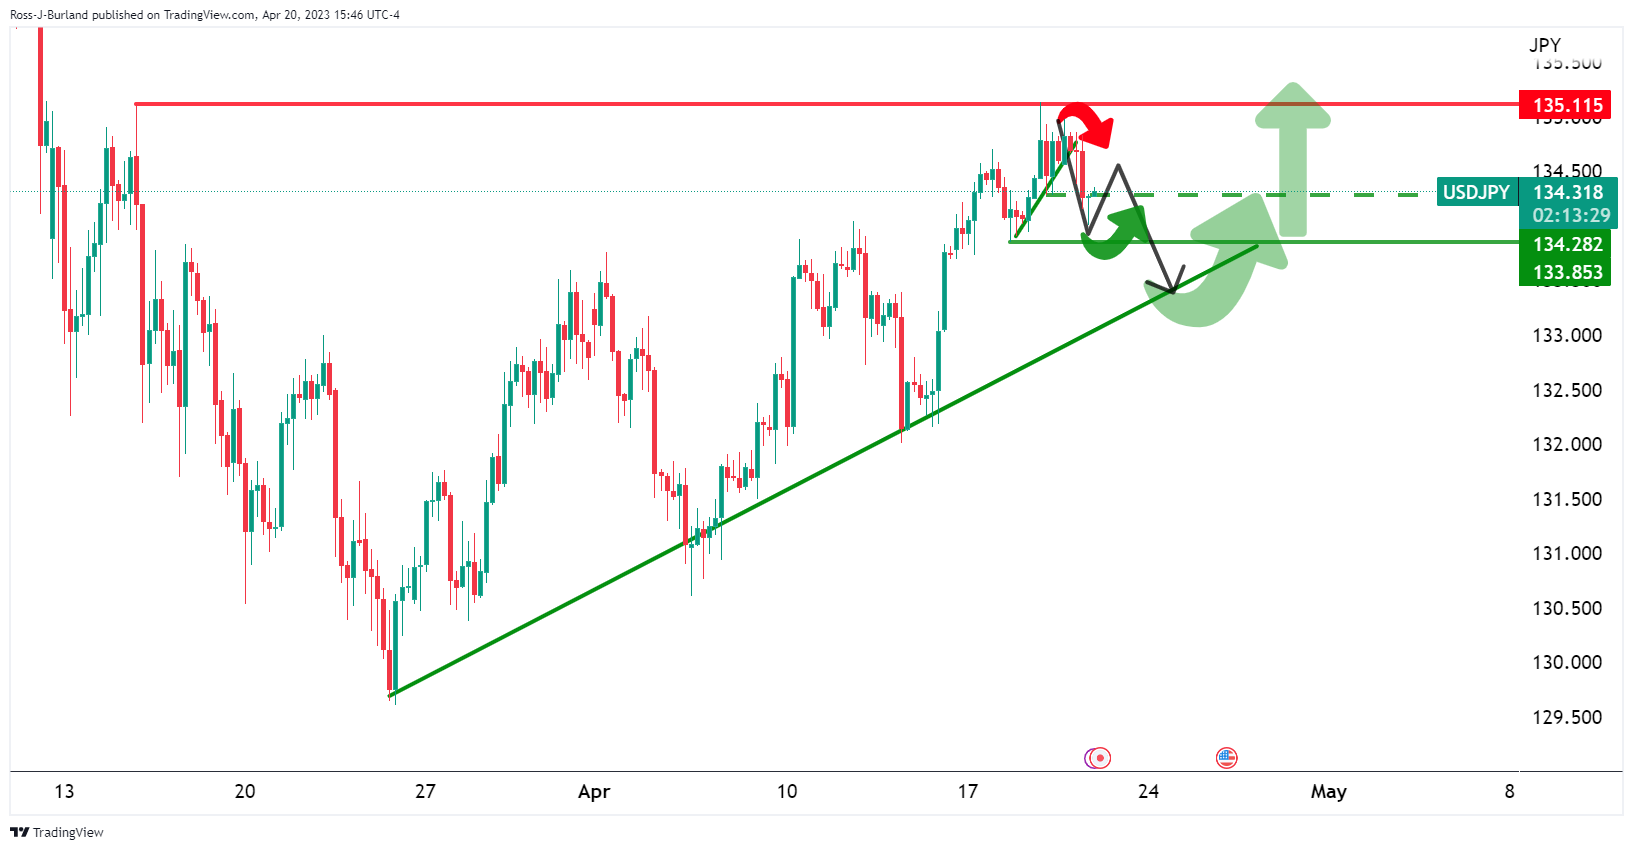
USD/JPY H4 charts
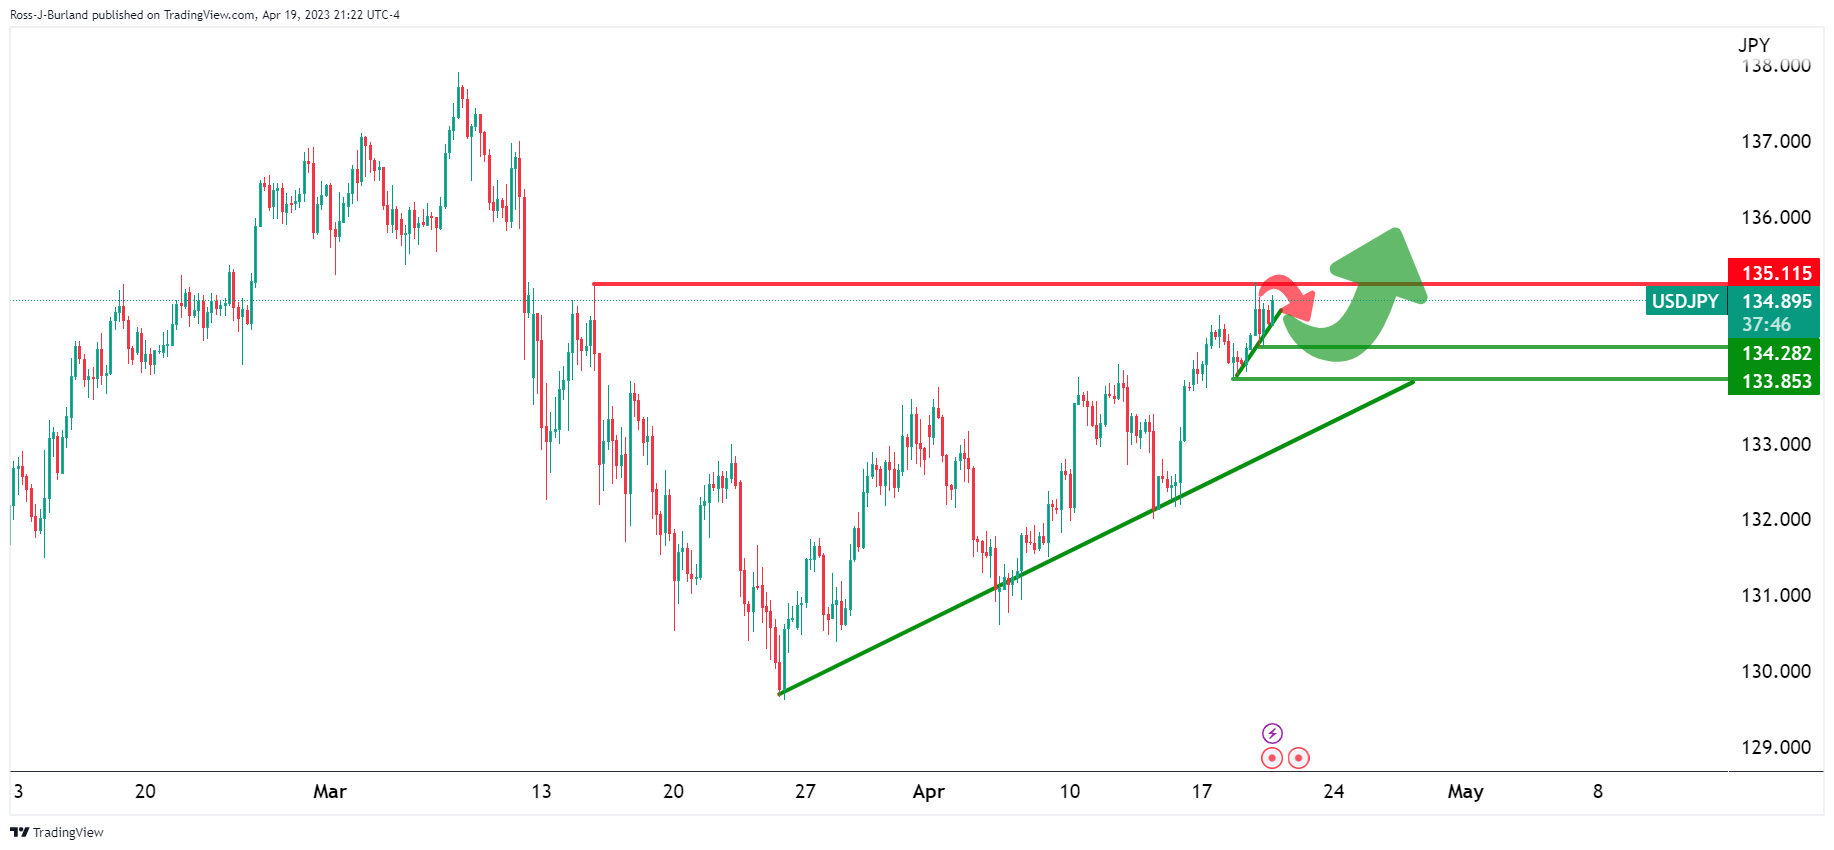
It was stated that the overall bullish scenario, above, forecasted the prospects of a break of the micro trendline and a move to test the low 134s before the bulls engaged again for the push higher, as per the weekly W-formation´s outlook explained and illustrated in the prior analysis. A more bearish scenario, below, highlighted the chances of a breakdown into the broader trendline support.
USD/JPY updates
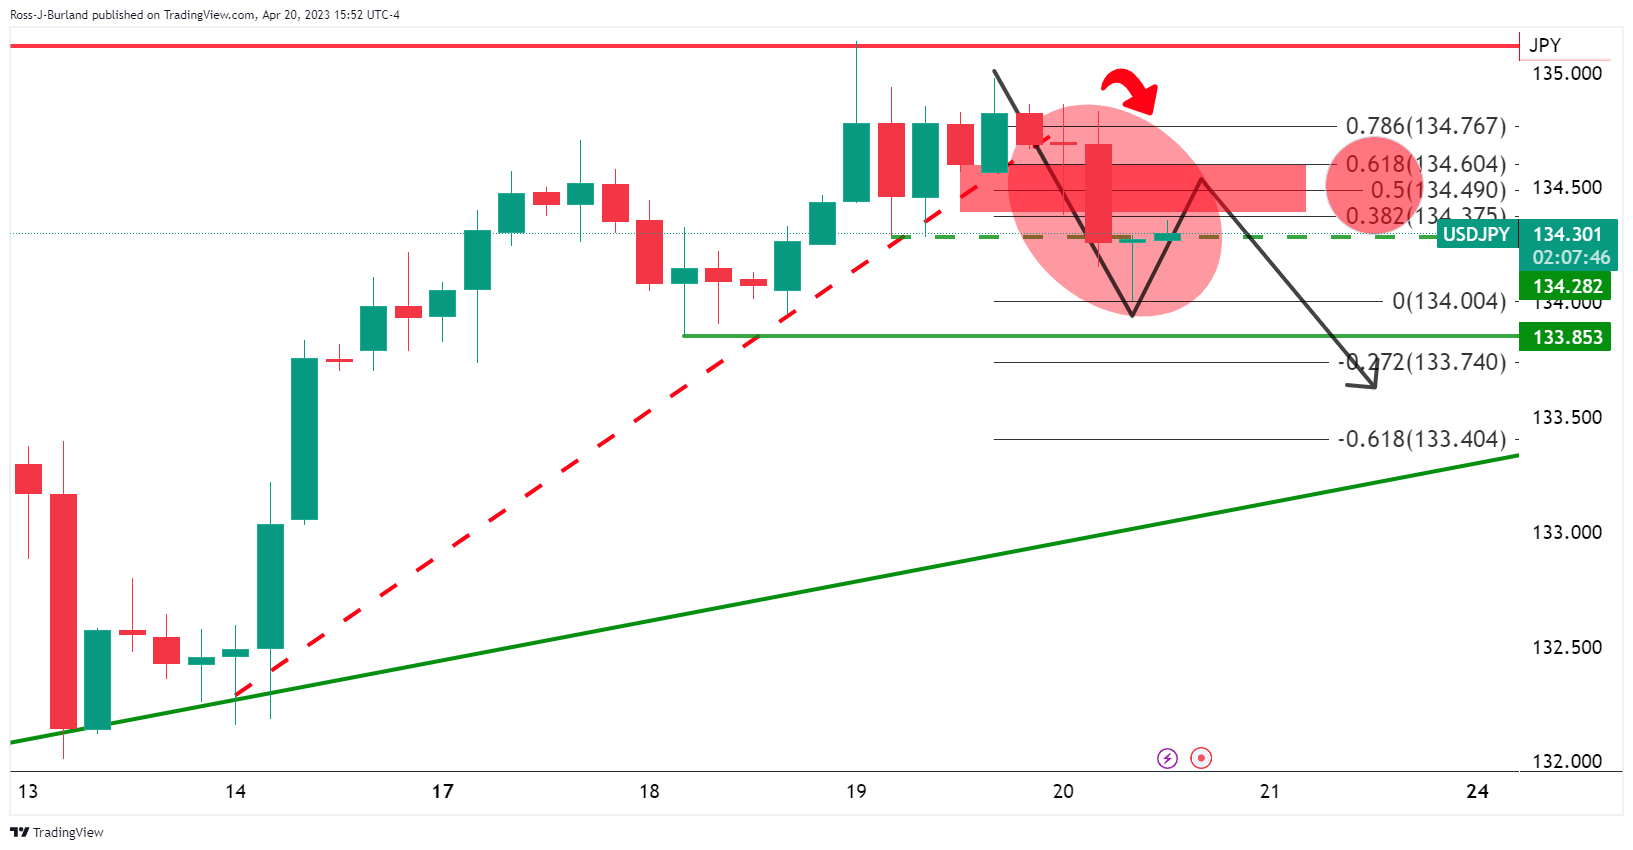
We are seeing a break in the structure in the 134.20s which leaves the focus on the downside.
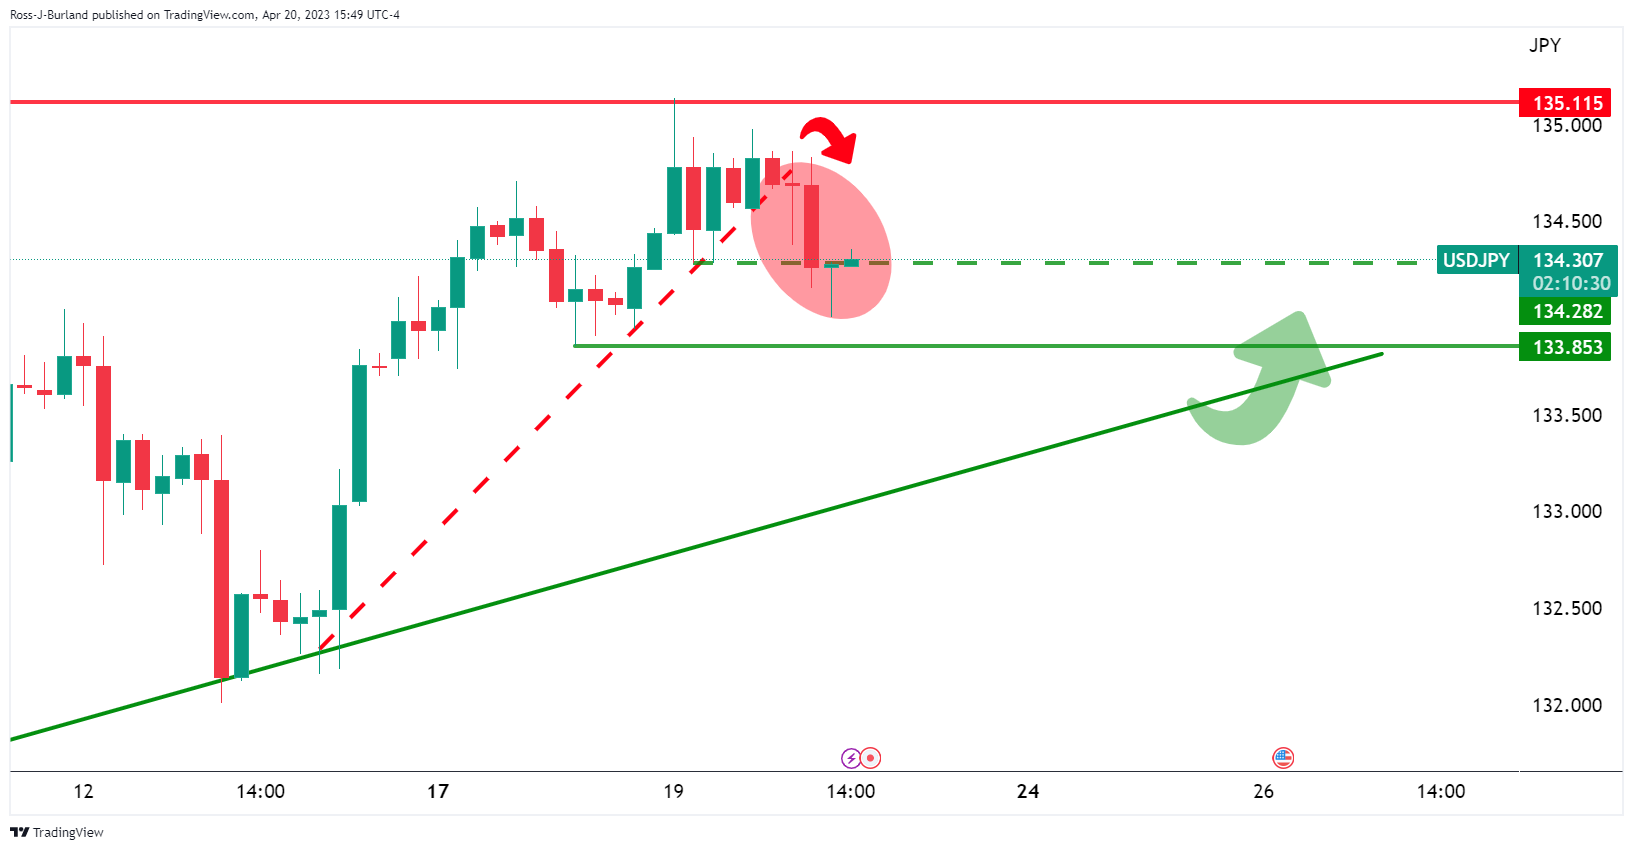
However, a bullish correction of the break in structure is underway and the following offers a potential trajectory in the price encompassing a correction and then a downside continuation:
Pulling up the Fibonacci scale, we can see that the prior support aligns with a cluster of Fibos between the 38.2% and 61.8% ratios and a 50% mean reversion in-between.