- Gold Price Forecast: XAU/USD fails to sustain above $2,000 as investors digest renewed US banking woes
Notícias do Mercado
Gold Price Forecast: XAU/USD fails to sustain above $2,000 as investors digest renewed US banking woes
- Gold price has sensed selling pressure while shifting its auction above $2,000 as US banking jitters eased.
- A rangebound performance is expected from the US Dollar ahead of the release of the United States Durable Goods Orders.
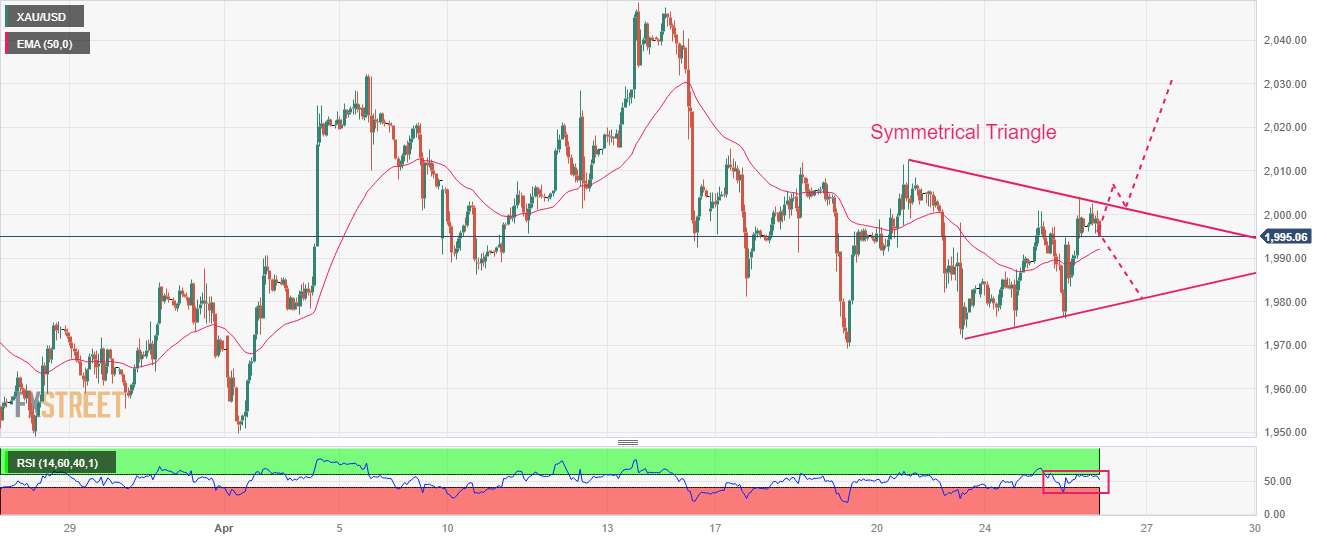
- Gold price is auctioning in a Symmetrical Triangle pattern that conveys a volatility contraction.
Gold price (XAU/USD) is struggling to shift its auction above the psychological resistance of $2,000.00 in the Asian session. The precious metal showed a stellar rally on Tuesday as investors hid behind bullions to safeguard themselves from renewed banking jitters.
The quarterly earnings report of First Republic Bank showed that customers’ deposits have dropped significantly than estimates and the commercial bank has to rely on outside funds for disbursement of advances, which will come at a higher interest rate and will impact its Net Interest Margins (NIMs).
However, investors have started digesting renewed banking woes and are moving funds into the S&P500 futures. The 500-US stocks basket futures have added immense gains in the Asian session, portraying a solid recovery in the risk appetite of the market participants. Meanwhile, the 10-year US Treasury yields have also rebounded to 3.41%.
The US Dollar Index (DXY) is consolidating above 101.80 after a minor correction and is expected to continue its rangebound performance ahead of the release of the United States Durable Goods Orders (March) data. As per the estimates, monthly economic data will expand by 0.8% vs. a contraction of 1.0%.
Gold technical analysis
Gold price is auctioning in a symmetrical triangle chart pattern on an hourly scale, which indicates a sheer volatility contraction. The upward-sloping trendline of the triangle is placed from April 21 low at $1,971.62 while the downward-sloping trendline is plotted from April 20 high at $2,012.44. The Gold price is still above the 50-period Exponential Moving Average (EMA) at $1,992.32, which indicates that the upside bias is still solid.
A 40.00-60.00 range oscillation by the Relative Strength Index (RSI) (14) indicates that investors are awaiting a potential trigger.
Gold hourly chart