- USD/JPY Price Analysis: Yen traders flirt with 135.00 key support, rising wedge in focus
Notícias do Mercado
USD/JPY Price Analysis: Yen traders flirt with 135.00 key support, rising wedge in focus
- USD/JPY struggles to extend three-day uptrend within weekly bearish chart formation.
- Steady oscillators suggest further grinding of Yen prices.
- 100, 200 SMAs and monthly support line act as additional downside filters.
- Bulls may aim for 138.00 on defying rising wedge pattern.
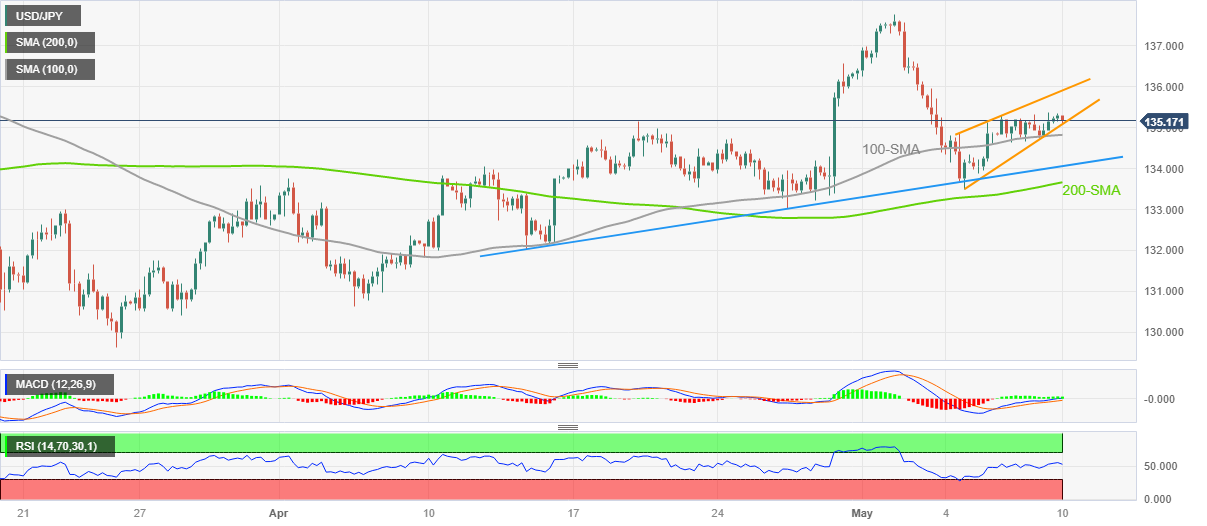
USD/JPY retreats to 135.15 as it prods a three-day winning streak heading into Wednesday’s European session. In doing so, the Yen pair eases within a one-week-old rising wedge bearish chart pattern.
Sluggish MACD signals and a steady RSI (14) line hint at the USD/JPY pair’s further easing. However, a clear downside break of the stated wedge’s lower line, close to 135.00 by the press time, will confirm the wedge formation suggesting a theoretical fall toward the 133.00 round figure.
Though, the 100-bar Simple Moving Average (SMA) and an upward-sloping support line from April 13, respectively near 134.80 and 134.00, can prod the USD/JPY bears afterward.
It’s worth observing that the Yen pair’s run-up after crossing the 200-SMA level during mid-April highlights the stated key moving average, around 133.65 at the latest, as a major challenge for the bears.
Meanwhile, USD/JPY recovery may find multiple hurdles near 135.50, a break of which could direct the pair towards the stated wedge’s top line, near 135.90 as we write.
In a case where the Yen pair remains firmer past 135.90, the 136.00 round figure may act as an extra check for the bulls before pushing them for another battle with the 138.00 hurdle comprising tops marked in March and May 2023.
USD/JPY: Four-hour chart
Trend: Further downside expected