- WTI Price Analysis: Oil bears eye further downside towards $70.70-60
Notícias do Mercado
WTI Price Analysis: Oil bears eye further downside towards $70.70-60
- WTI crude oil takes offers to refresh intraday low, drops for the third consecutive day.
- Clear downside break of key HMAs, sluggish oscillators favor the black gold’s further declines.
- One-week-old horizontal support can prod energy bears amid nearly oversold RSI, looming bull cross on MACD.
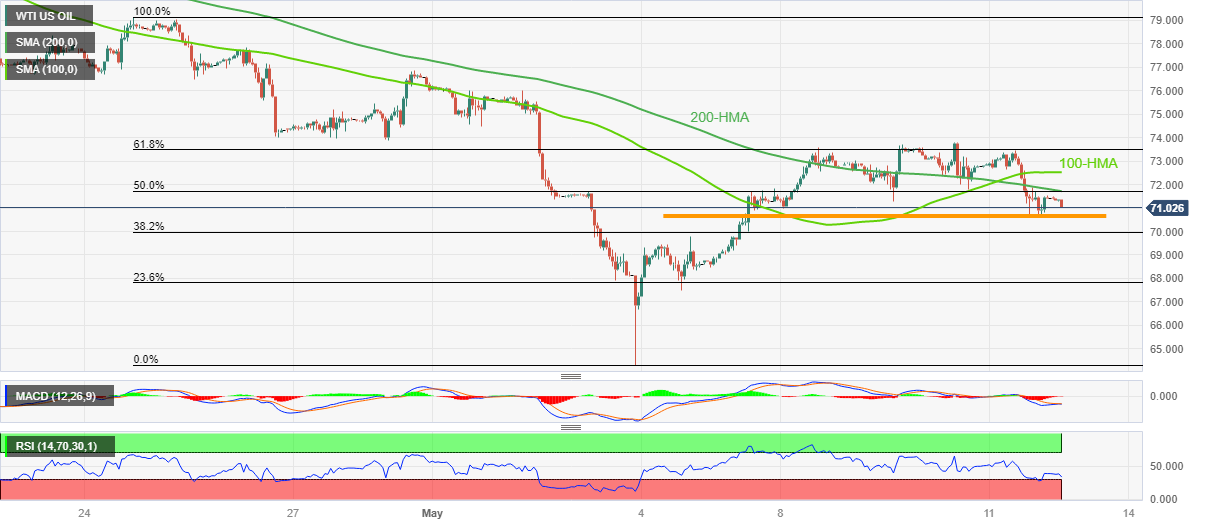
WTI crude oil remains pressured for the third consecutive day after reversing from a one-week high, taking offers to refresh intraday bottom around $71.10 amid early Friday.
In doing so, the energy benchmark justifies the previous day’s downside break of the 100 and 200 Hourly Moving Averages (HMAs). Adding strength to the bearish bias about the black gold are the sluggish conditions of the MACD and RSI indicators, also known as the oscillators.
It’s worth noting that a one-week-old horizontal support area surrounding $70.70-60 joins nears the oversold RSI (14) line to restrict the immediate downside of the WTI crude oil.
Following that, the $70.00 psychological magnet and $69.50 may entertain the Oil sellers before directing them to the recently flashed multi-month low of around $64.30.
On the contrary, a convergence of the 200-HMA and a 50% Fibonacci retracement level of the Oil Price weakness from April 24 to May 03, near $71.70, appears a tough nut to crack for the energy buyers to convince the markets.
Even so, a successful break of the 100-HMA and 61.8% Fibonacci retracement level, also known as the golden Fibonacci ratio, respectively near $72.55 and $73.50, becomes necessary for the WTI bulls to retake control.
WTI crude oil: Hourly chart

Trend: Limited downside expected