- Gold Price Forecast: XAU/USD stays bearish below $2,030, US debt ceiling talks eyed – Confluence Detector
Notícias do Mercado
Gold Price Forecast: XAU/USD stays bearish below $2,030, US debt ceiling talks eyed – Confluence Detector
- Gold price snaps two-week winning streak, slides beneath $2,030 confluence level.
- US debt ceiling talks, banking woes join hawkish Fed bets to propel US Dollar and weigh on XAU/USD.
- US policymakers will gather early next week to overcome default fears, Fed’s Powell also up for a speech.
Gold price (XAU/USD) prints a three-day downtrend to recall the bears, after their fortnight-old recess, as mixed sentiment allows the US Dollar to remain firmer. Adding strength to the XAU/USD bearish bias could be the fears of US debt ceiling expiry after the policymakers pushed back the much-awaited talks of Friday to early next week. On the same line are the fears of witnessing an economic slowdown as US bank deposits slump.
It should be noted, however, that the hopes of recovery in China inflation and the US policymakers’ optimism challenge the Gold bears ahead of some more clues of the US inflation, which in turn can justify the latest hawkish Fed concerns. Apart from the US inflation signals, the next week’s US Retail Sales and a speech from Federal Reserve (Fed) Chairman Jerome Powell will also be important to watch for near-term Gold price moves.
Also read: Gold Price Forecast: For how long can XAU/USD defend 21 DMA support?
Gold Price: Key levels to watch
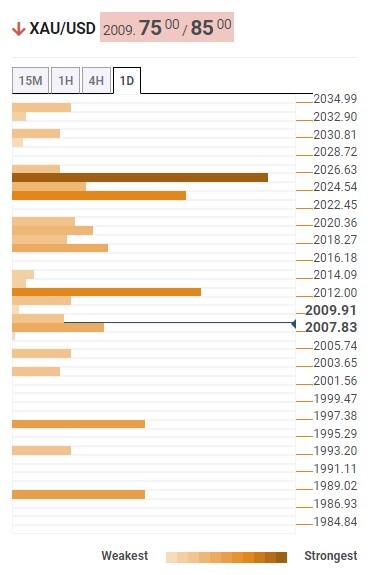
As per our Technical Confluence Indicator, the Gold price remains bearish below the key $2,025 support confluence comprising the middle band of the Bollinger on the four-hour (4H) play and Fibonacci 23.6% on one month.
That said, the metal recently slipped beneath the $2,010 level and pleased bears to cheer the first weekly loss in three. The said support, now immediate resistance, encompasses Fibonacci 38.2% on one-month, previous daily low and lower band of the Bollinger on the four-hour chart.
It’s worth noting that 5-DMA and Fibonacci 38.2% on one-day together highlight $2,023 as a short-term key upside hurdle.
Meanwhile, there prevails a smooth road towards the south for the Gold price even as it flirts with the $2,000 round figure. That said, Pivot Point one-day S2 acts as an extra downside filter around $1,990.
Following that, Fibonacci's 61.8% level on one-month can act as the last defense of the Gold buyers near $1,985.
Here is how it looks on the tool
About Technical Confluences Detector
The TCD (Technical Confluences Detector) is a tool to locate and point out those price levels where there is a congestion of indicators, moving averages, Fibonacci levels, Pivot Points, etc. If you are a short-term trader, you will find entry points for counter-trend strategies and hunt a few points at a time. If you are a medium-to-long-term trader, this tool will allow you to know in advance the price levels where a medium-to-long-term trend may stop and rest, where to unwind positions, or where to increase your position size.