- EUR/USD Price Analysis: Bulls eye a run to test trendline resistance near 1.0900-20
Notícias do Mercado
15 maio 2023
EUR/USD Price Analysis: Bulls eye a run to test trendline resistance near 1.0900-20
- A strong test of the trendline resistance in EUR/USD could be on the cards.
- US Dollar is pressured and gives EUR bulls an advantage from daily support.
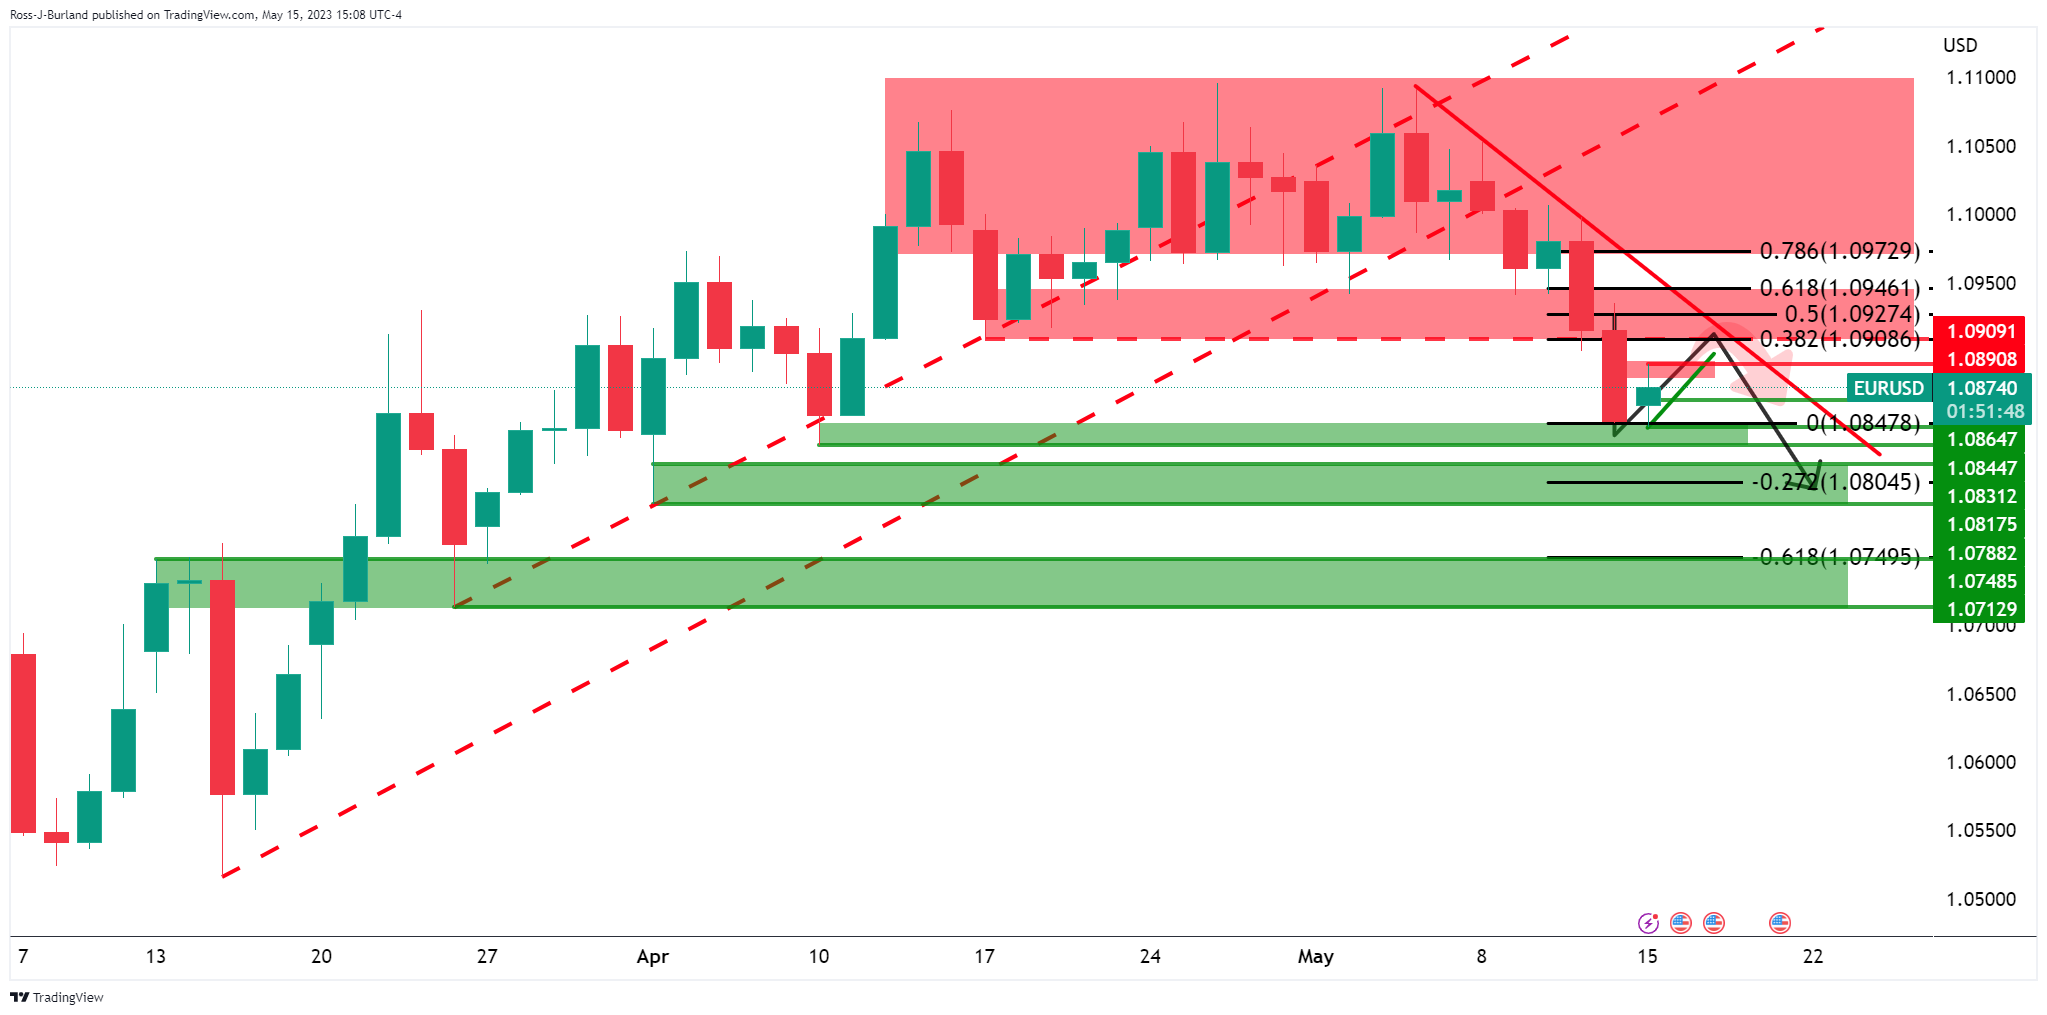
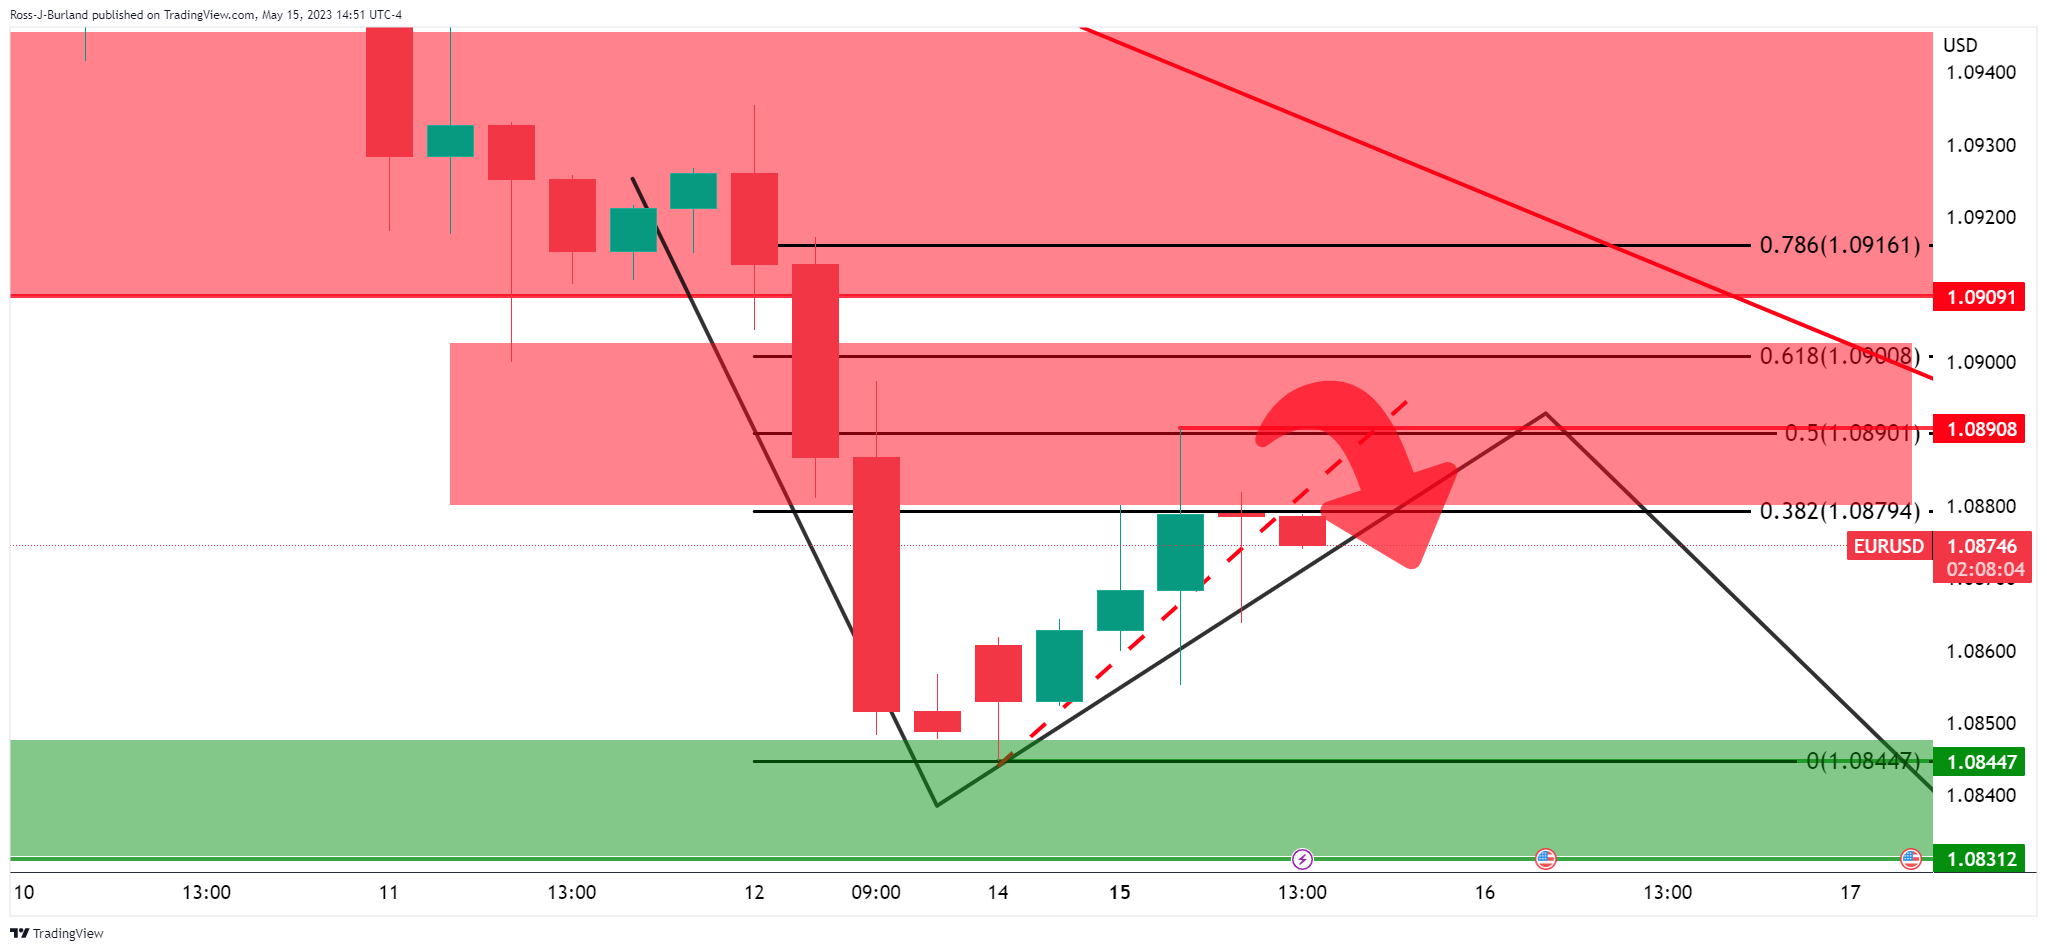
EUR/USD bull's eye a strong continuation on the correction to the 38.2% Fibonacci 1.0900 and then1.0920s as the 50% mean reversion area.
EUR/USD daily chart
The case for the downside will build when we see a deceleration of the correction which might still be in its initial days.
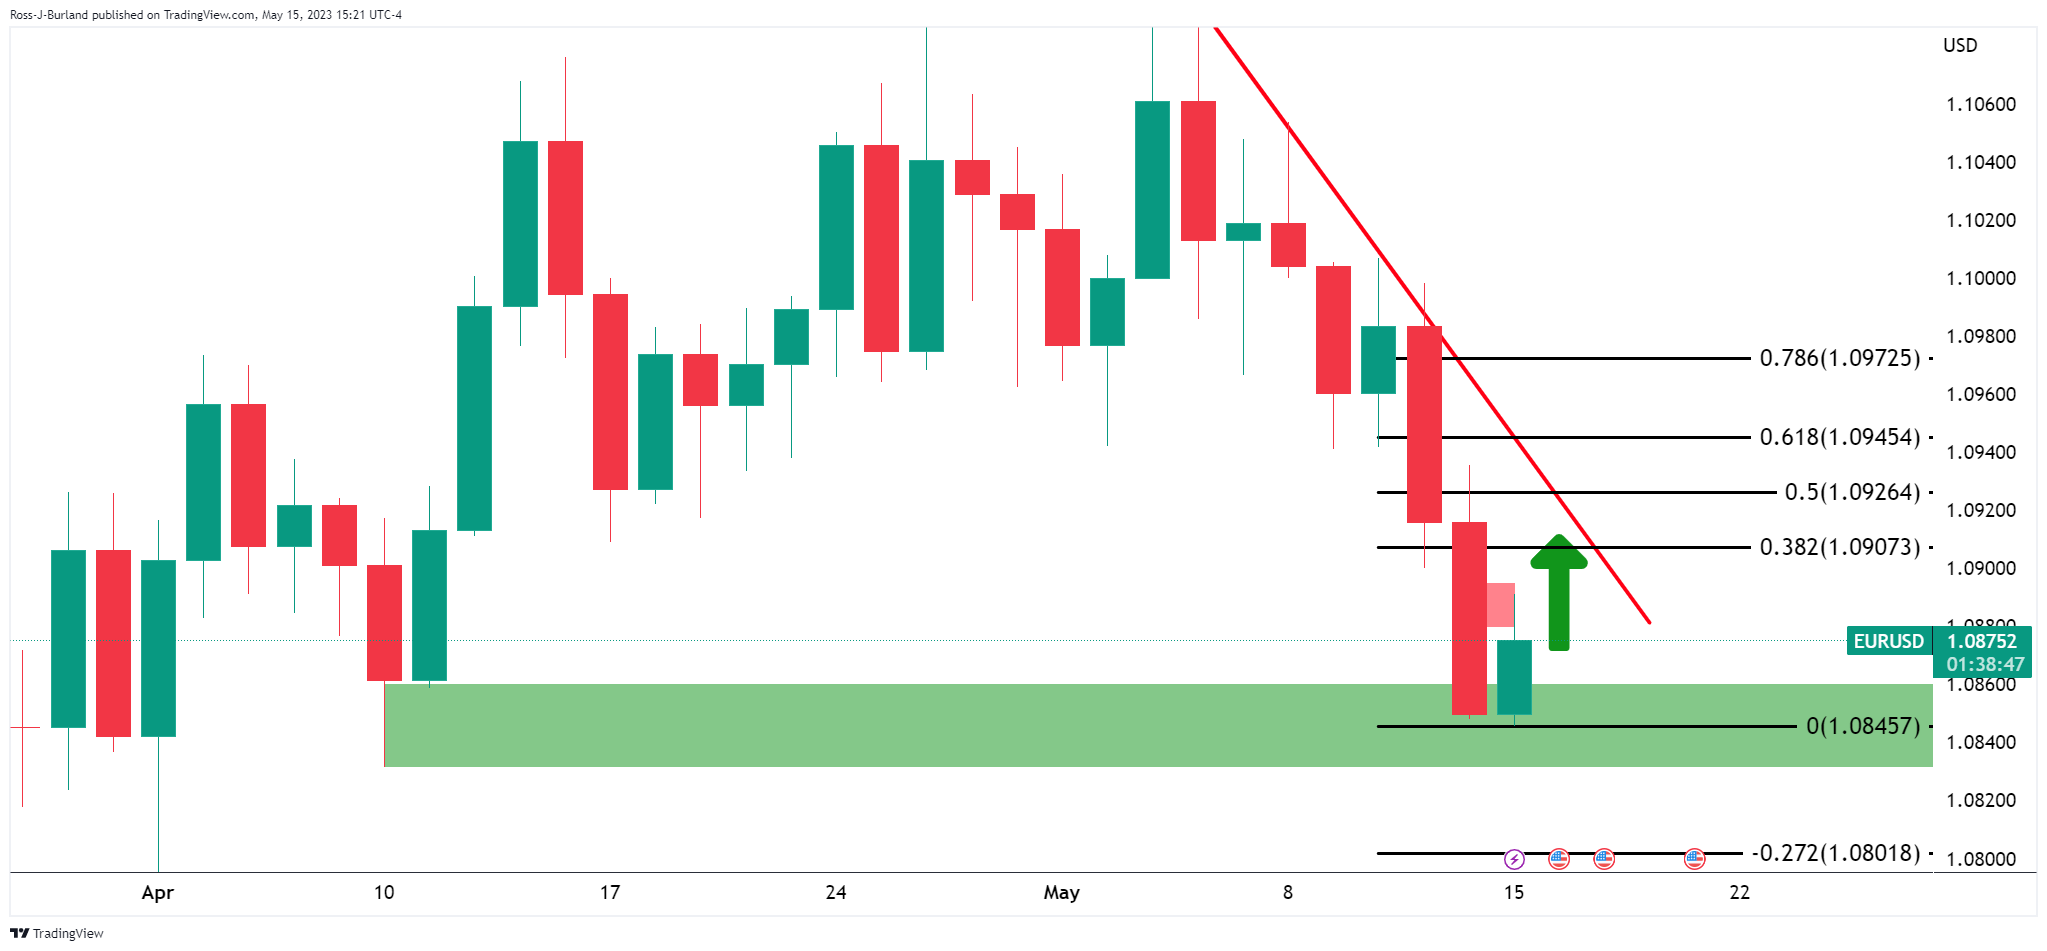
EUR/USD H4 charts
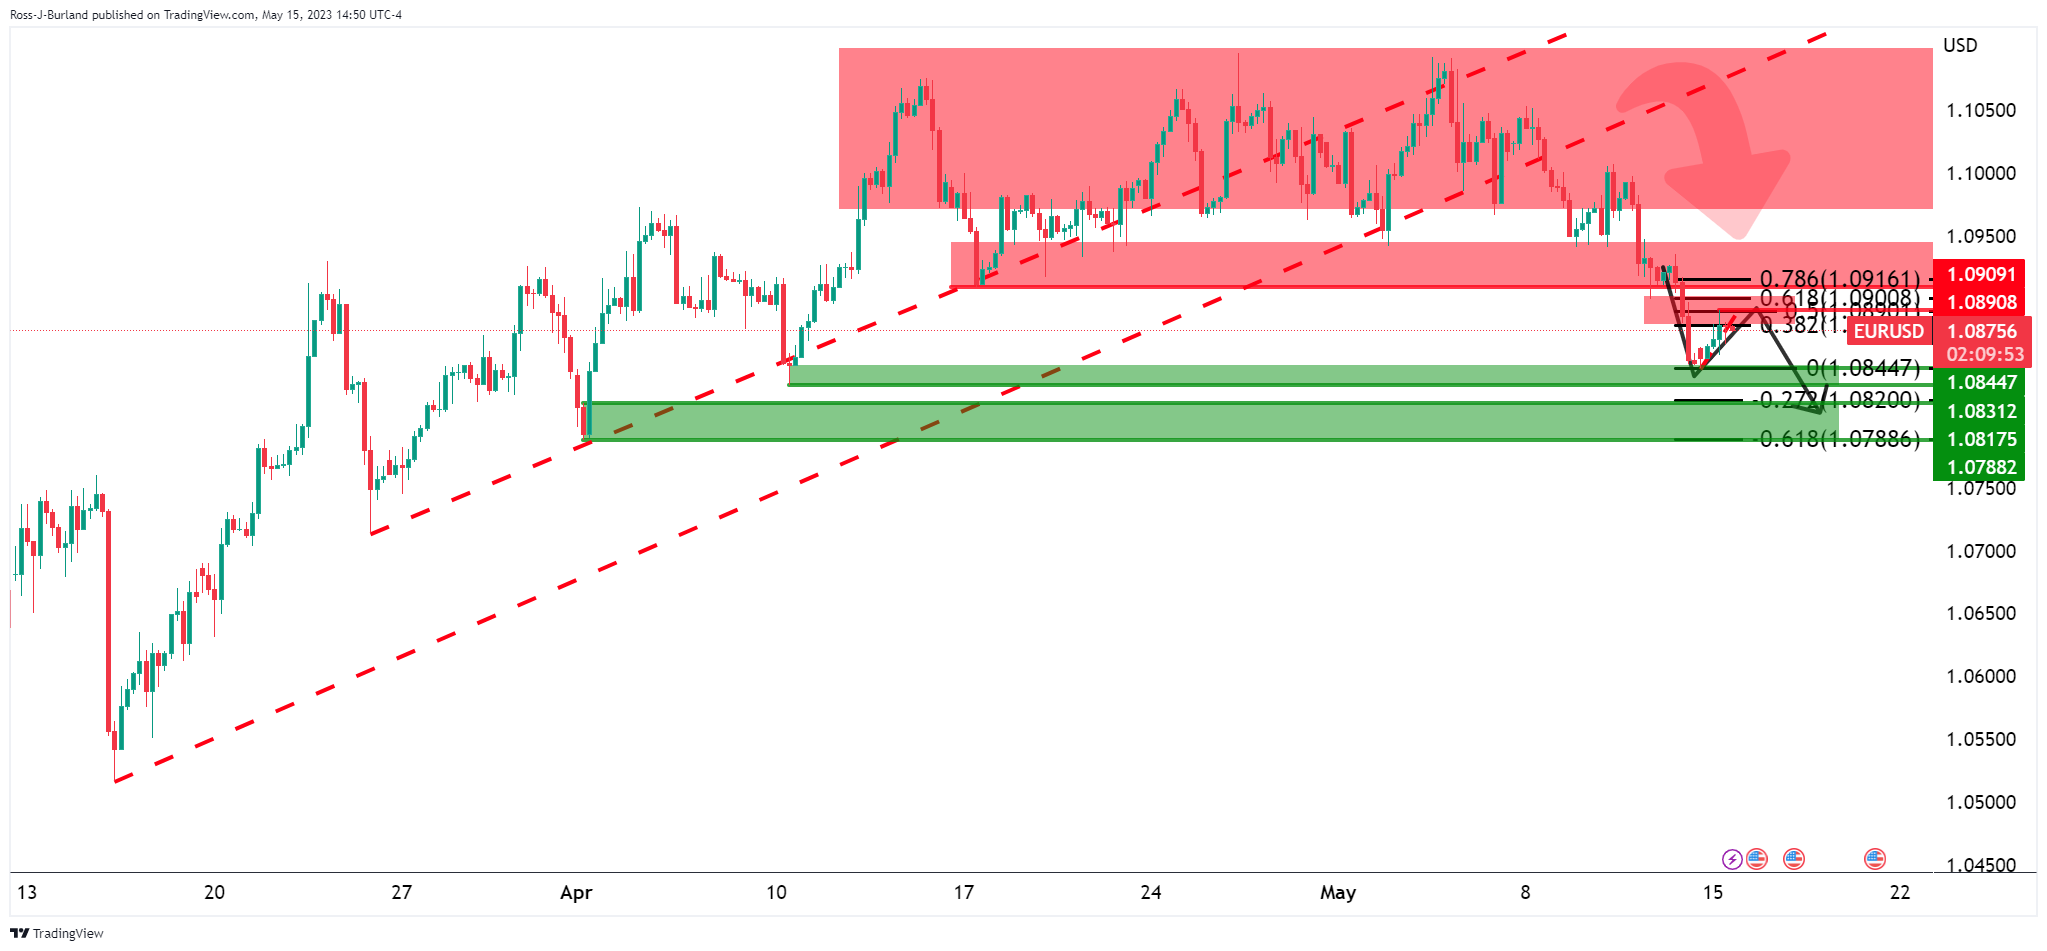
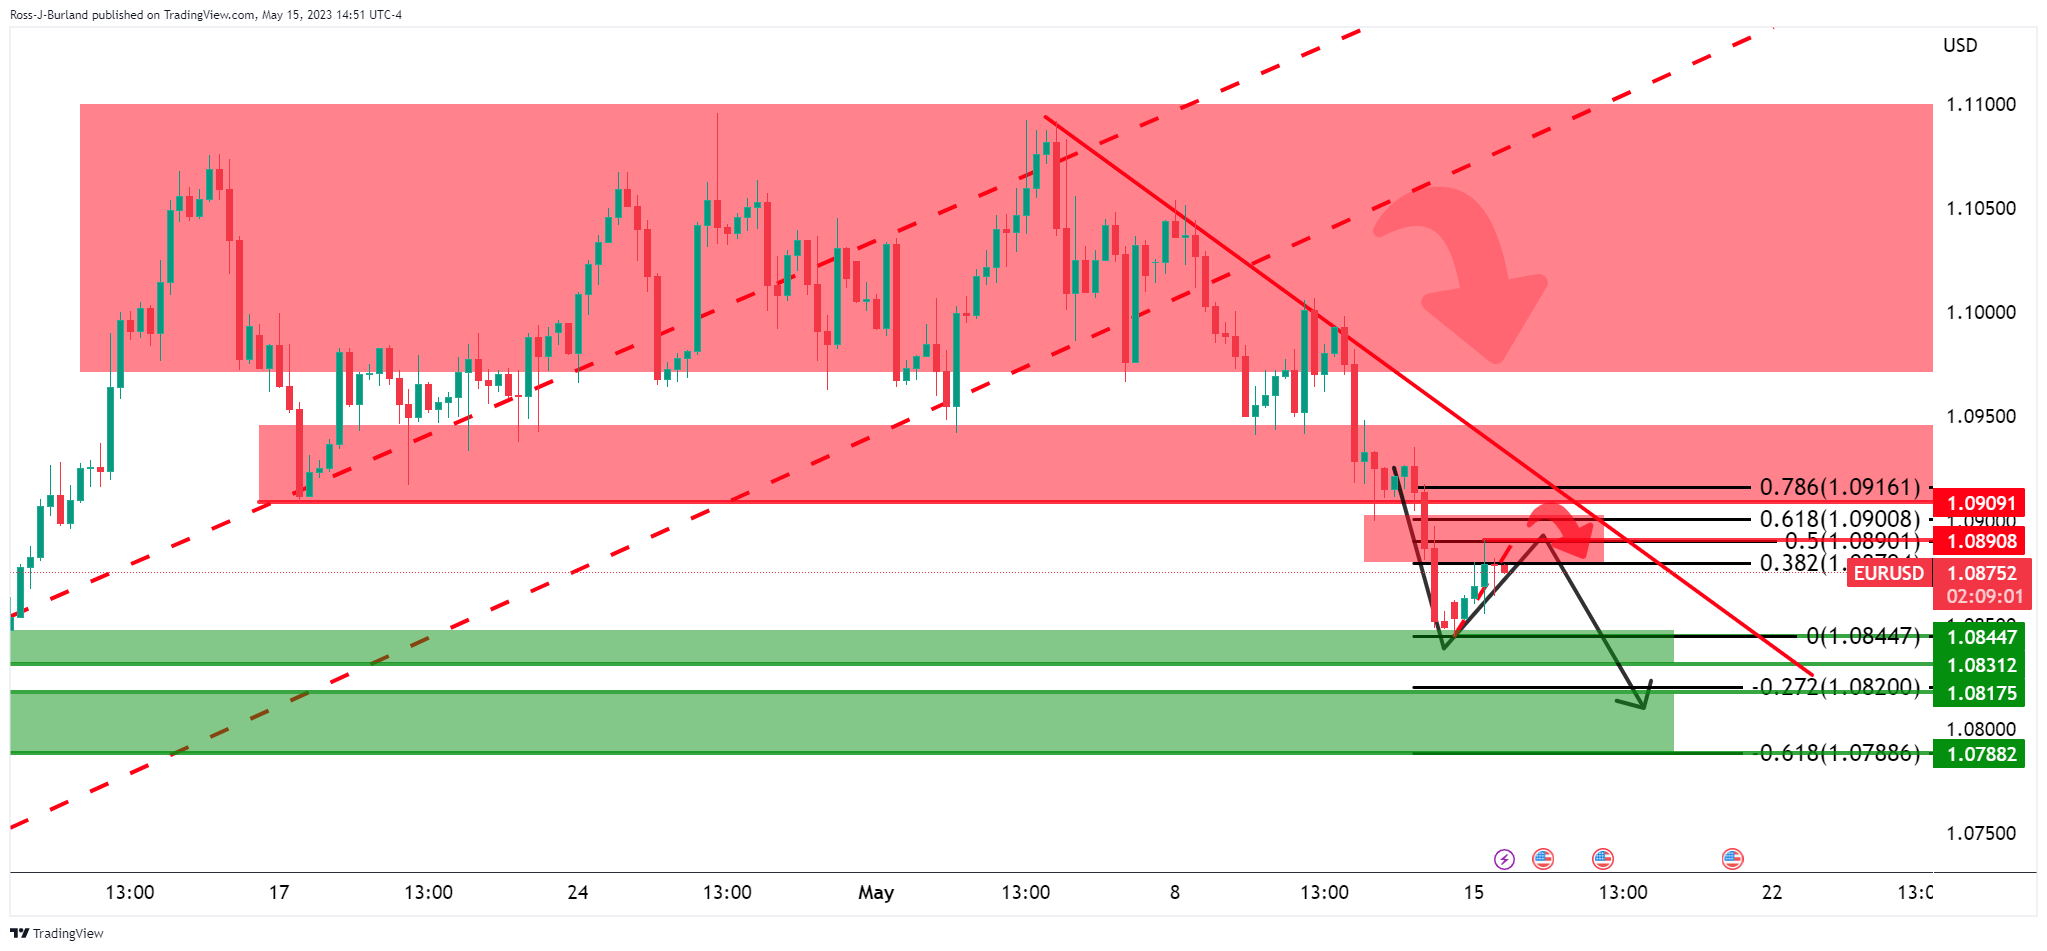
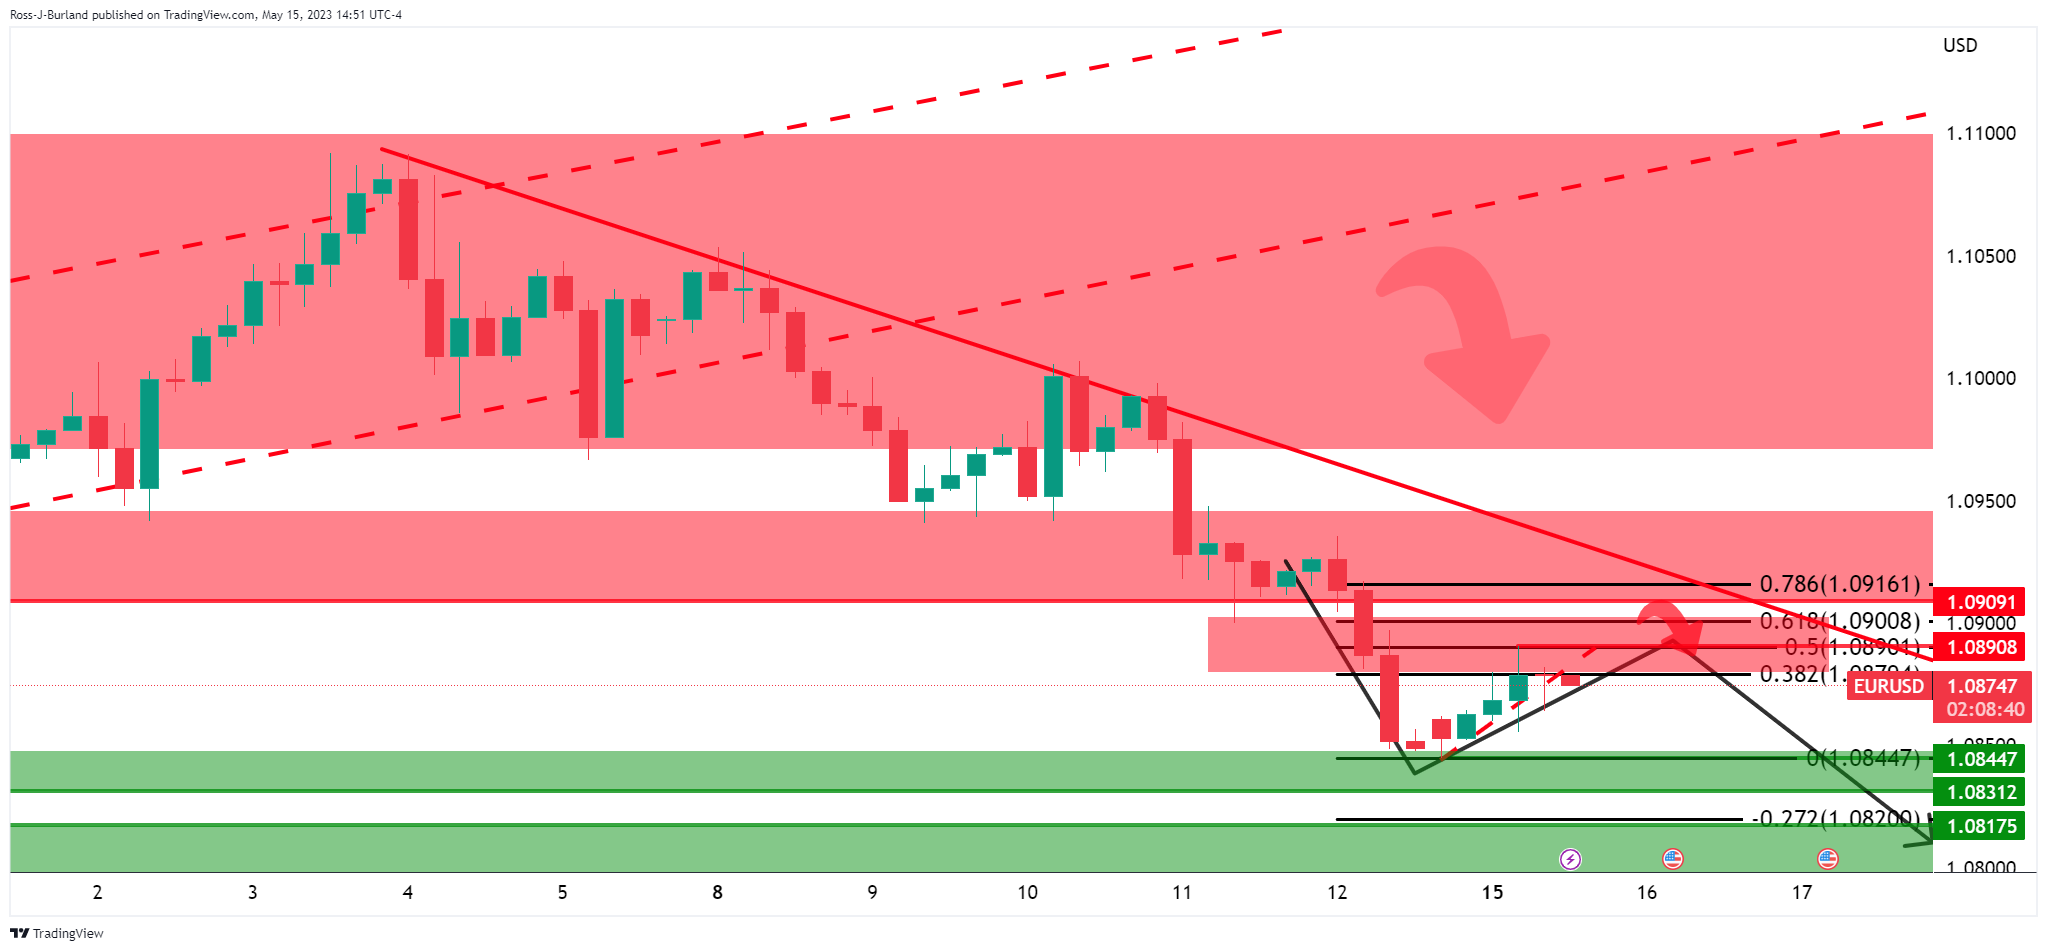
However, there are prospects of a move lower on the lower time frames, such as the H4 chart above and the H1 chart below:
EUR/USD H1 chart

With all that being said, however, the daily chart remains biased to the upside:
A 38.2% Fibonacci correction comes in near 1.0900 and 1.0920s and thereafter sees the 50% mean reversion area that would make for a strong test of the trendline resistance.
O foco de mercado
Abrir Conta Demo e Página Pessoal