- GBP/JPY Price Analysis: Surges above 170.00 after the bullish-harami candle pattern emerges
Notícias do Mercado
GBP/JPY Price Analysis: Surges above 170.00 after the bullish-harami candle pattern emerges
- GBP/JPY forms a falling wedge and double bottom chart pattern, piercing the 20-day EMA.
- The pair must crack the two-week-old resistance trendline to aim for a YTD high of 172.33.
- RSI and 3-day RoC indicators support further upside potential for GBP/JPY.
After forming a bullish-harami candlestick pattern last Friday, GBP/JPY prints back-to-back positive gains, later confirmed by Monday’s price action. The GBP/JPY reached a low of 168.86 before rallying sharply, towards 170.49. At the time of writing, the GBP/JPY is trading at 170.47.
GBP/JPY Price Analysis: Technical outlook
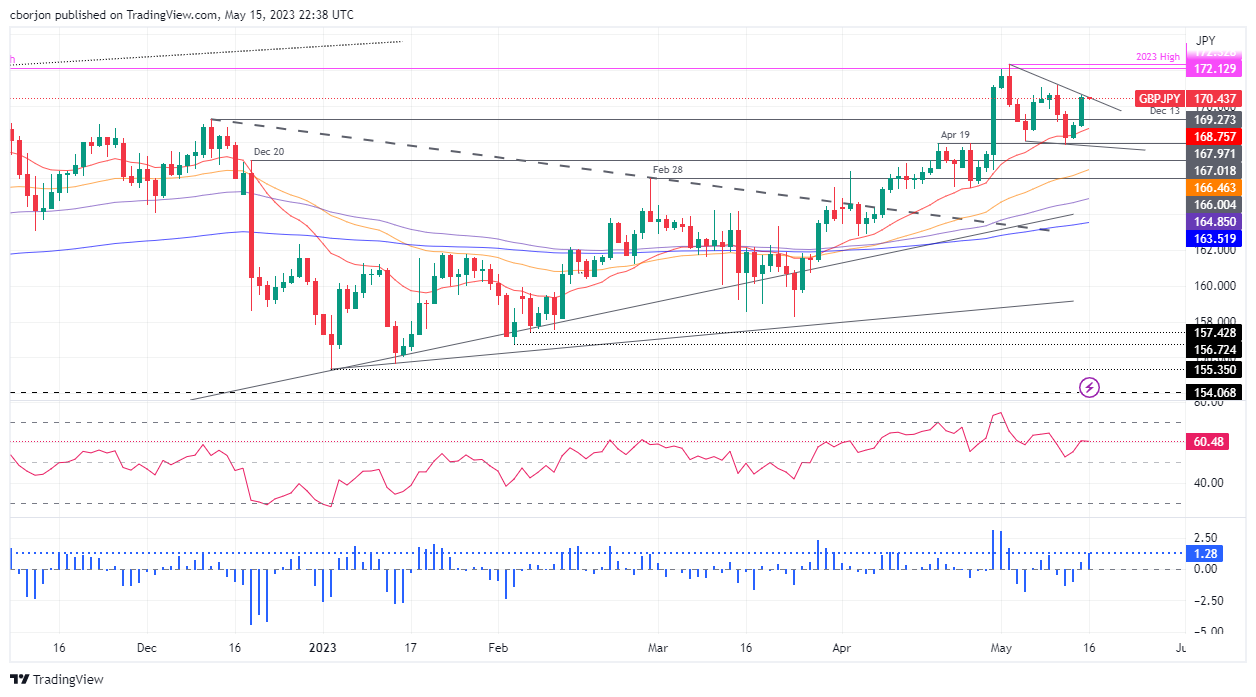
Since the last days of April, the GBP/JPY began to form a falling wedge that also turned into a double bottom chart pattern in the daily chart. The GBP/JPY bottomed at around 167.84 and pierced the 20-day Exponential Moving Average (EMA) at 168.76 before climbing back toward the 170.00 figure area.
On its way up, the GBP/JPY must crack a two-week old resistance trendline at around 170.30/50. Once done, the GBP/JPY would aim toward the year-to-date (YTD) high of 172.33. But firstly, the GBP/JPY needs to clear some resistance levels. The first supply zone would be the May 10 daily high of 171.17. A breach of the latter will expose 172.13, the last year’s high, before testing 172.33.
Conversely, a drop below 170.00, the GBP/JPY can pull back toward the December 13 daily high-turned-support at 169.27, followed by the 20-day EMA at 168.75. Downside risks lie at the 168.00 figure before testing the 167.50 area.
The Relative Strength Index (RSI) indicator suggests further upside is warranted, and the 3-day Rate of Change (RoC), portrays the GBP/JPY could register another leg-up towards testing the YTD high.
GBP/JPY Price Action – Daily chart