- GBP/JPY Price Analysis: Breaks falling wedge, eyes the YTD high above 172.00
Notícias do Mercado
GBP/JPY Price Analysis: Breaks falling wedge, eyes the YTD high above 172.00
- GBP/JPY breaks falling wedge approaches YTD high of 172.33; currently trading at 171.86, down 0.01%.
- The technical outlook turns bullish, but resistance at 173.00 and 175.00 could pose challenges for further gains.
- Negative divergence on the RSI indicator suggests a possible pullback; downside risks emerge below the 170.00 psychological figure.
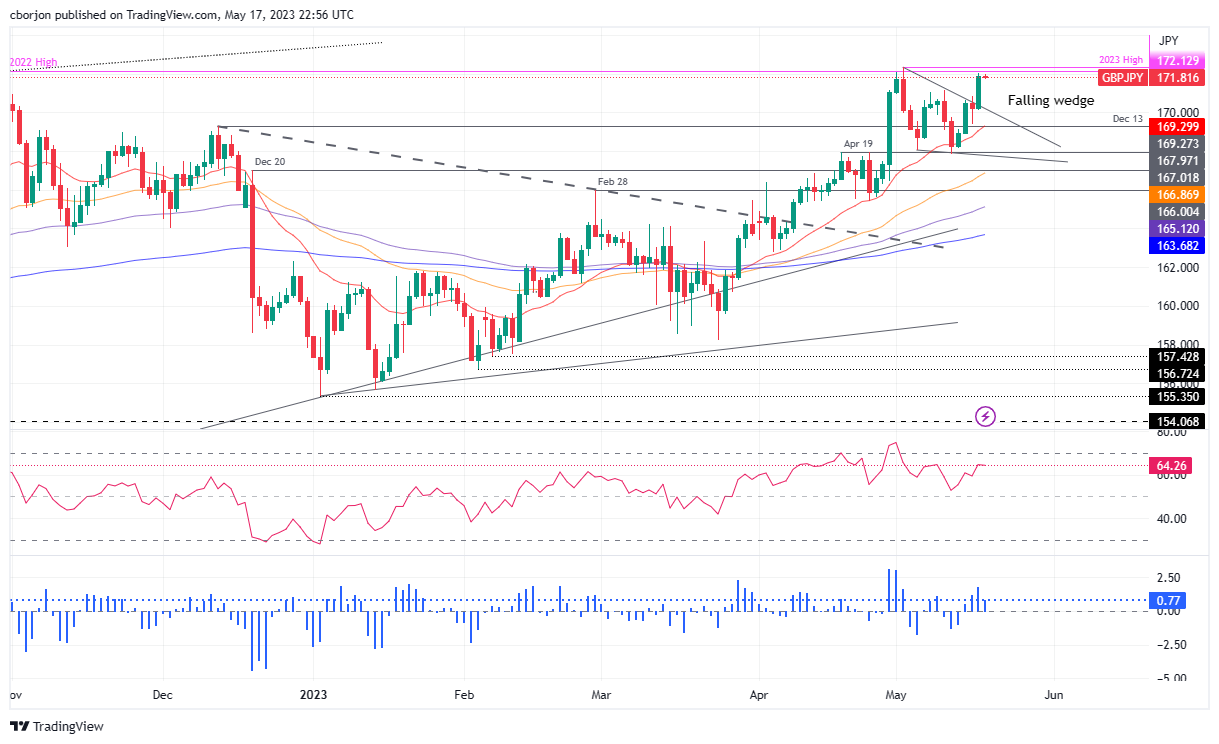
The GBP/JPY rallied sharply as a falling wedge, usually a bullish chart pattern, has been broken decisively to the upside, and the GBP/JPY approaches the year-to-date (YTD) high of 172.33 as the Asian session begins. At the time of writing, the GBP/JPY is trading at 171.86, down 0.01%.
GBP/JPY Price Analysis: Technical outlook
The GBP/JPY uptrend remains intact from a daily chart perspective, but solid resistance levels will be tested in the short term. If the GBP/JPY breaks 172.33, that could open the door for further gains, supported by momentum oscillators, turning bullish.
Although bullish, the Relative Strength Index (RSI) indicator printed a lower peak than the previous one, while price action is reaching higher highs. That means a negative divergence could emerge, meaning that a pullback might be on the cards.
But if GBP/JPY breaks above 173.00, the next resistance to challenge would be the 175.00 figure. Once cleared, the GBP/JPY could rally towards the 2016 year high of 177.37. A breach of the latter, and the next supply zone, would be the 180.00 figure, which could open the door for a test of 2015 high of 195.88.
Conversely, a failure at 172.00, the GBP/JPY could retreat towards the May 16 high of 170.83. Break below will expose the May 17 daily low of 170.11 before cracking the 170.00 psychological figure.
GBP/JPY Price Action – Daily chart