- Silver Price Analysis: XAG/USD clashes with resistance around $23.30s amid a downward bias
Notícias do Mercado
Silver Price Analysis: XAG/USD clashes with resistance around $23.30s amid a downward bias
- Silver prices wrestle with a $23.37 resistance, nudging the XAG/USD towards daily lows as sellers eye lower targets amidst bearish indicators.
- Despite achieving a double-top objective, XAG/USD continues to face downward pressure; a fall below $23.00 could spur further losses.
- Overcoming the 100-day EMA at $23.46 could set the XAG/USD against resistances at $23.50 and the $23.90/$23.97 EMA intersection, eventually aiming for $24.00.
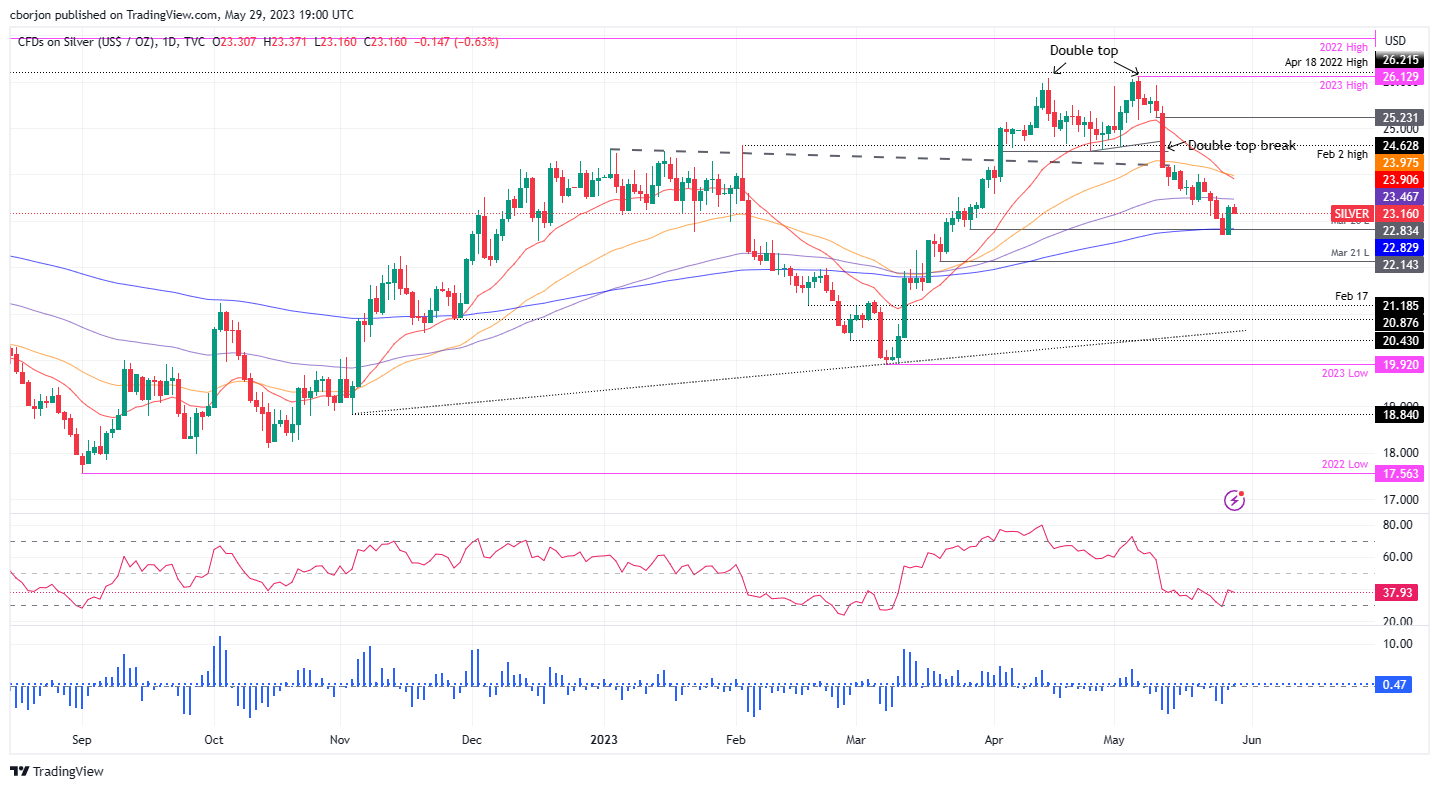
Silver price faces solid resistance around the $23.37 area as the 100-day Exponential Moving Average (EMA) sits around $23.46, pushing the XAG/USD spot price toward its daily lows of $23.15, with sellers eyeing lower prices. In addition, technical indicators turned bearish, with further downward action expected. At the time of writing, the XAG/USD is trading at $23.16.
XAG/USD Price Analysis: Technical outlook
From a technical point of view, XAG/USD is neutral to downward biased, capped on the upside by strong resistance levels. Even though the double-top measured objective was achieved on May 25, piercing below the $23.00 figure, downward pressure continues to mount on the white metal. Nevertheless, last Friday, profit-taking by sellers lifted the XAG/USD above $23.00.
The XAG/USD must drop below the $23.00 mark for a bearish continuation. A breach of the latter will expose the last week's low of $22.68, followed by the March 21 low of $22.14. that could exacerbate further losses toward the $22.00 figure.
In contrast, if XAG/USD pierces the 100-day EMA at $23.46, the next line resistance would be $23.50, followed by the intersection of the 20 and 50-day EMAs at $23.90/$23.97, immediately followed by $24.00.
XAG/USD Price Action – Daily chart