- USD/JPY Price Analysis: Overbought RSI prods bulls at yearly high around 143.00
Notícias do Mercado
USD/JPY Price Analysis: Overbought RSI prods bulls at yearly high around 143.00
- USD/JPY seesaws around the highest levels in seven months, prods two-day winning streak.
- Overbought RSI (14) line challenges Yen pair within bearish chart formation.
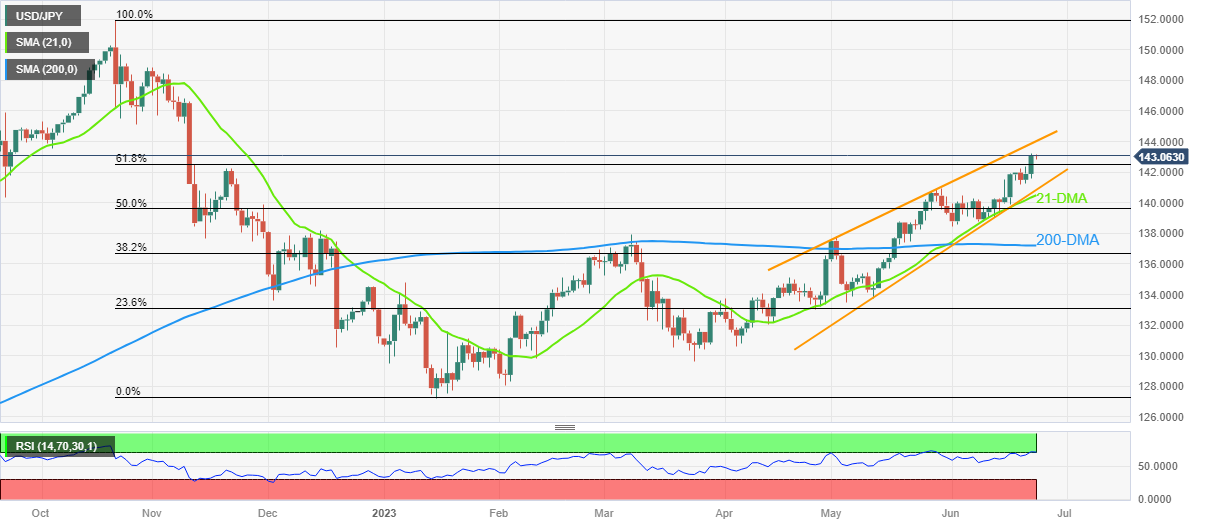
- 21-DMA, 200-DMA act as extra downside filters, rising wedge confirmation becomes necessary for sellers entry.
- Golden Fibonacci ratio, broad US Dollar strength amid risk-off mood restrict immediate declines.
USD/JPY makes rounds to 143.00 amid a lackluster Friday morning in Europe, after refreshing the yearly top the previous day. In doing so, the Yen pair pauses the previous two-day uptrend amid an overbought RSI (14) line. Adding strength to the quote’s latest inaction could be the cautious mood ahead of the US PMIs and fears of the US recession. It’s worth noting that the risk-barometer pair also takes clues from Japan’s mixed inflation data and downbeat PMIs.
Also read: USD/JPY holds steady above 143.00 mark, near its highest level since November 2022
Even if the RSI (14) line prods the USD/JPY buyers with a two-month-old rising wedge bearish chart formation, the quote’s successful break of the 61.8% Fibonacci retracement level of October 2022 to January 2023 downside, near 142.50 at the latest, keeps the bulls hopeful.
It’s worth noting, however, the aforementioned wedge’s top line, around 144.00 by the press time, will challenge the USD/JPY pair’s further upside.
In a case where the Yen pair crosses the 144.00 hurdle, it defies the bearish chart pattern. Though, the October 2022 low near 145.10 can act as the last defense of the bears.
On the contrary, a downside break of the stated key technical level around 142.50, also known as the golden Fibonacci ratio, can direct the USD/JPY bears towards confirming the rising wedge bearish chart pattern, by poking the 140.80 support.
While a clear downside break of 140.80 suggests the USD/JPY pair’s theoretical south-run towards 131.00, the 21-DMA and the 200-DMA, respectively near 140.50 and 137.20, will act as extra checks for the sellers.
USD/JPY: Daily chart
Trend: Limited upside expected