- USD/INR Price Analysis: Bears not ready to give up yet, 200-day SMA holds the key
Notícias do Mercado
USD/INR Price Analysis: Bears not ready to give up yet, 200-day SMA holds the key
- USD/INR edges lower on Friday and extends the overnight pullback from a two-week high.
- The technical setup still favours bearish traders and supports prospects for additional losses.
- Some follow-through buying beyond the 82.25 area is needed to negate the negative outlook.
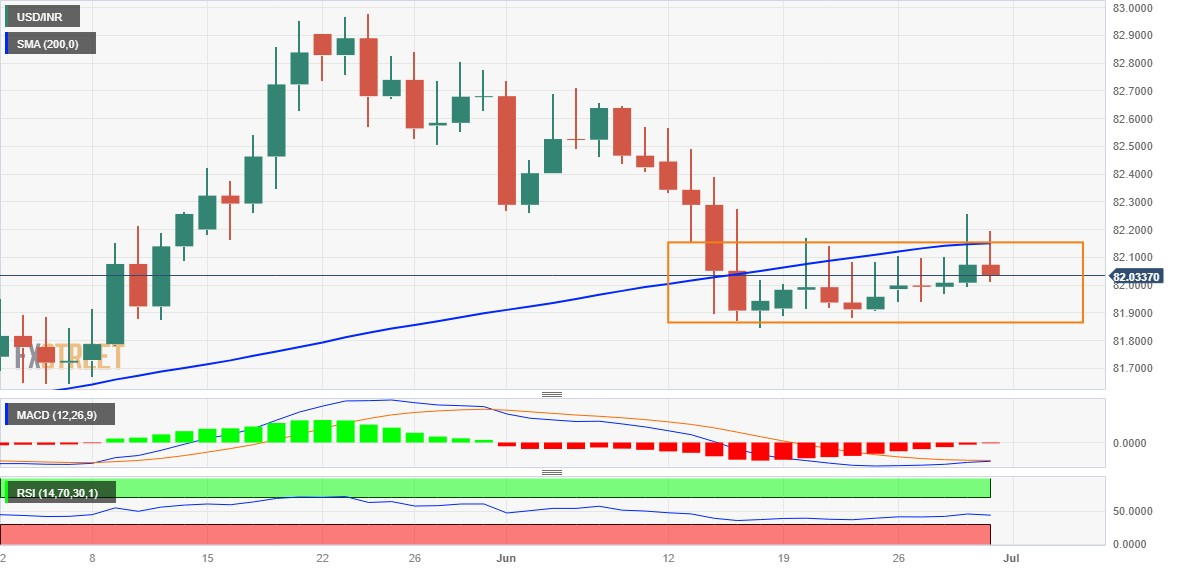
The USD/INR pair edges lower during the Asian session on Friday and moves further away from a two-week high, around the 82.25 region touched the previous day. Spot prices, however, manage to hold above the 82.00 mark and remain confined in a familiar trading band held over the past two weeks or so.
Against the backdrop of the recent pullback from the vicinity of the 83.00 mark, the recent range-bound price action might still be categorized as a bearish consolidation phase. Moreover, the overnight failure to find acceptance above a technically significant 200-day Simple Moving Average (SMA) and the subsequent slide suggests that the path of least resistance for the USD/INR pair is to the downside.
Furthermore, technical indicators on the daily chart - though have been recovering from lower levels - are still holding in the bearish territory. That said, it will still be prudent to wait for a sustained break below the trading range support, around the 81.85 area, before placing fresh bearish bets around the USD/INR pair and positioning for a slide to the 81.50 en route to sub-81.00 levels or the monthly swing low.
On the flip side, some follow-through buying beyond the overnight swing high, around the 82.25 region, could be seen as a positive breakout through the short-term trading range and pave the way for additional gains. The subsequent move up has the potential to lift the USD/INR pair back towards the 82.70-82.75 intermediate hurdle, above which bulls are likely to make a fresh attempt to conquer the 83.00 mark.
USD/INR daily chart

Key levels to watch