- EUR/USD Price Analysis: Bears lurking at key resistance
Notícias do Mercado
EUR/USD Price Analysis: Bears lurking at key resistance
- EUR/USD bears are moving in at key resistance.
- Bears eye the 61.8% Fibo and trendline support.
EUR/USD has rallied into a resistance area and there are prospects of a correction as per the following weekly chart analysis:
EUR/USD weekly charts
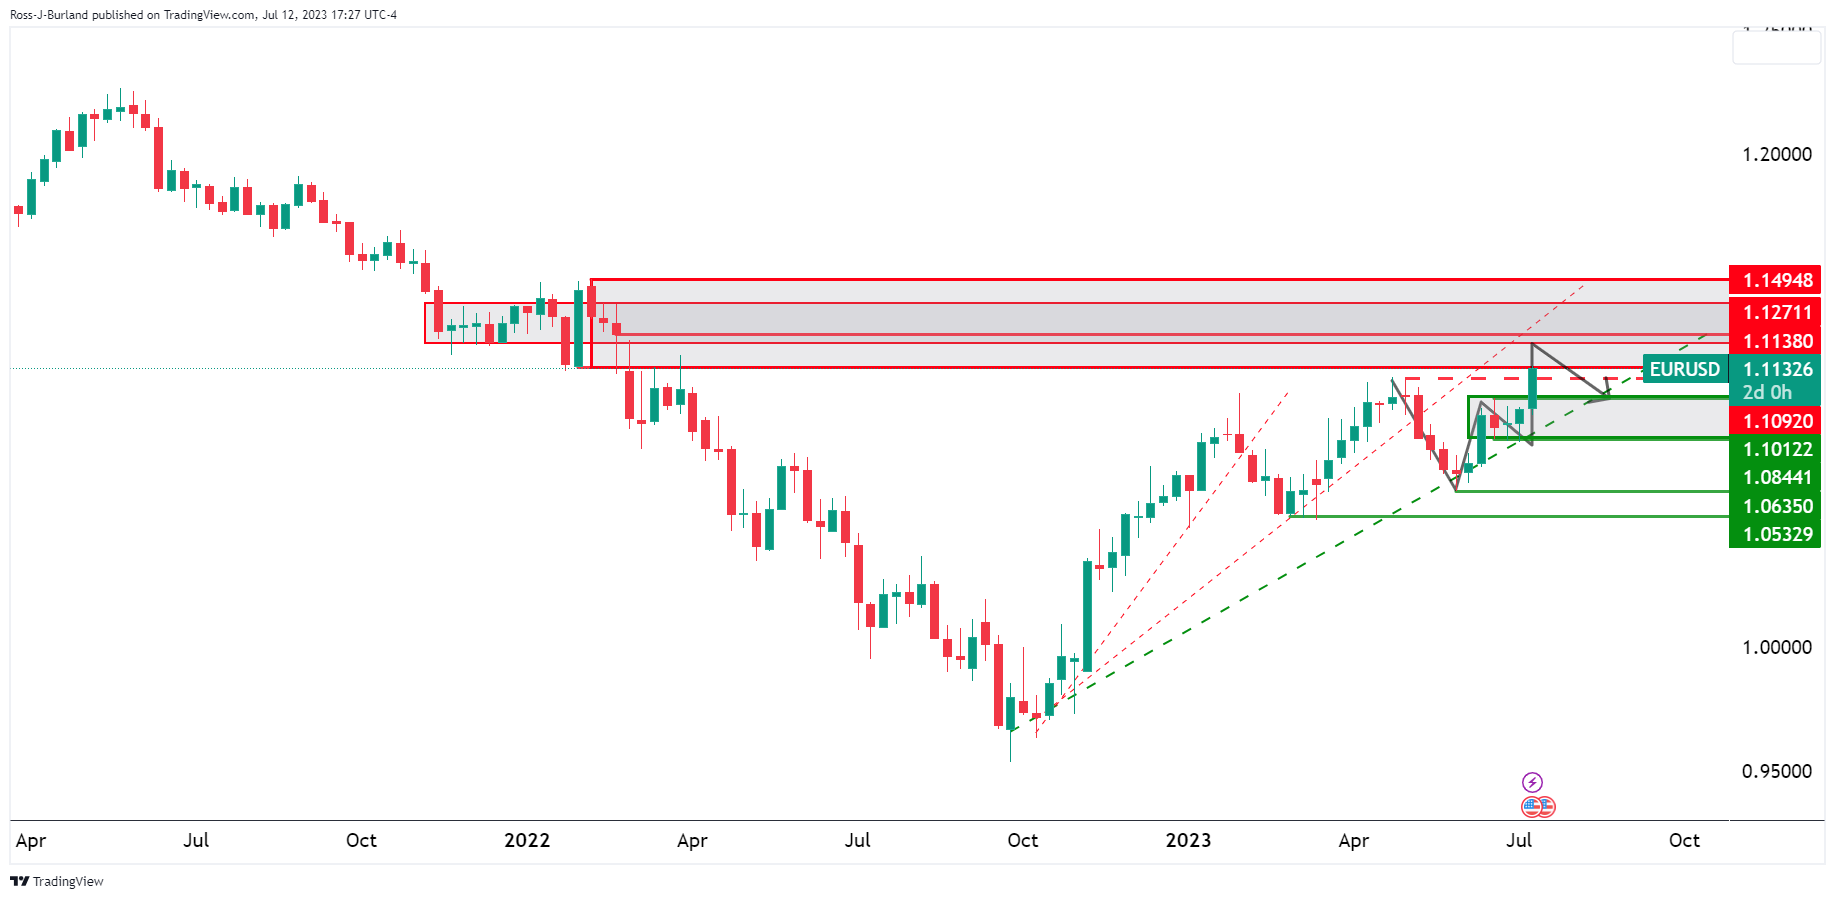
The weekly chart is leaving a W-formation on the chart and the bulls have reached a resistance area which leaves the focus on the downside. However, the bears will need to be patient and wait for a deceleration of the current rally. The lower time frames can be monitored for this purpose.
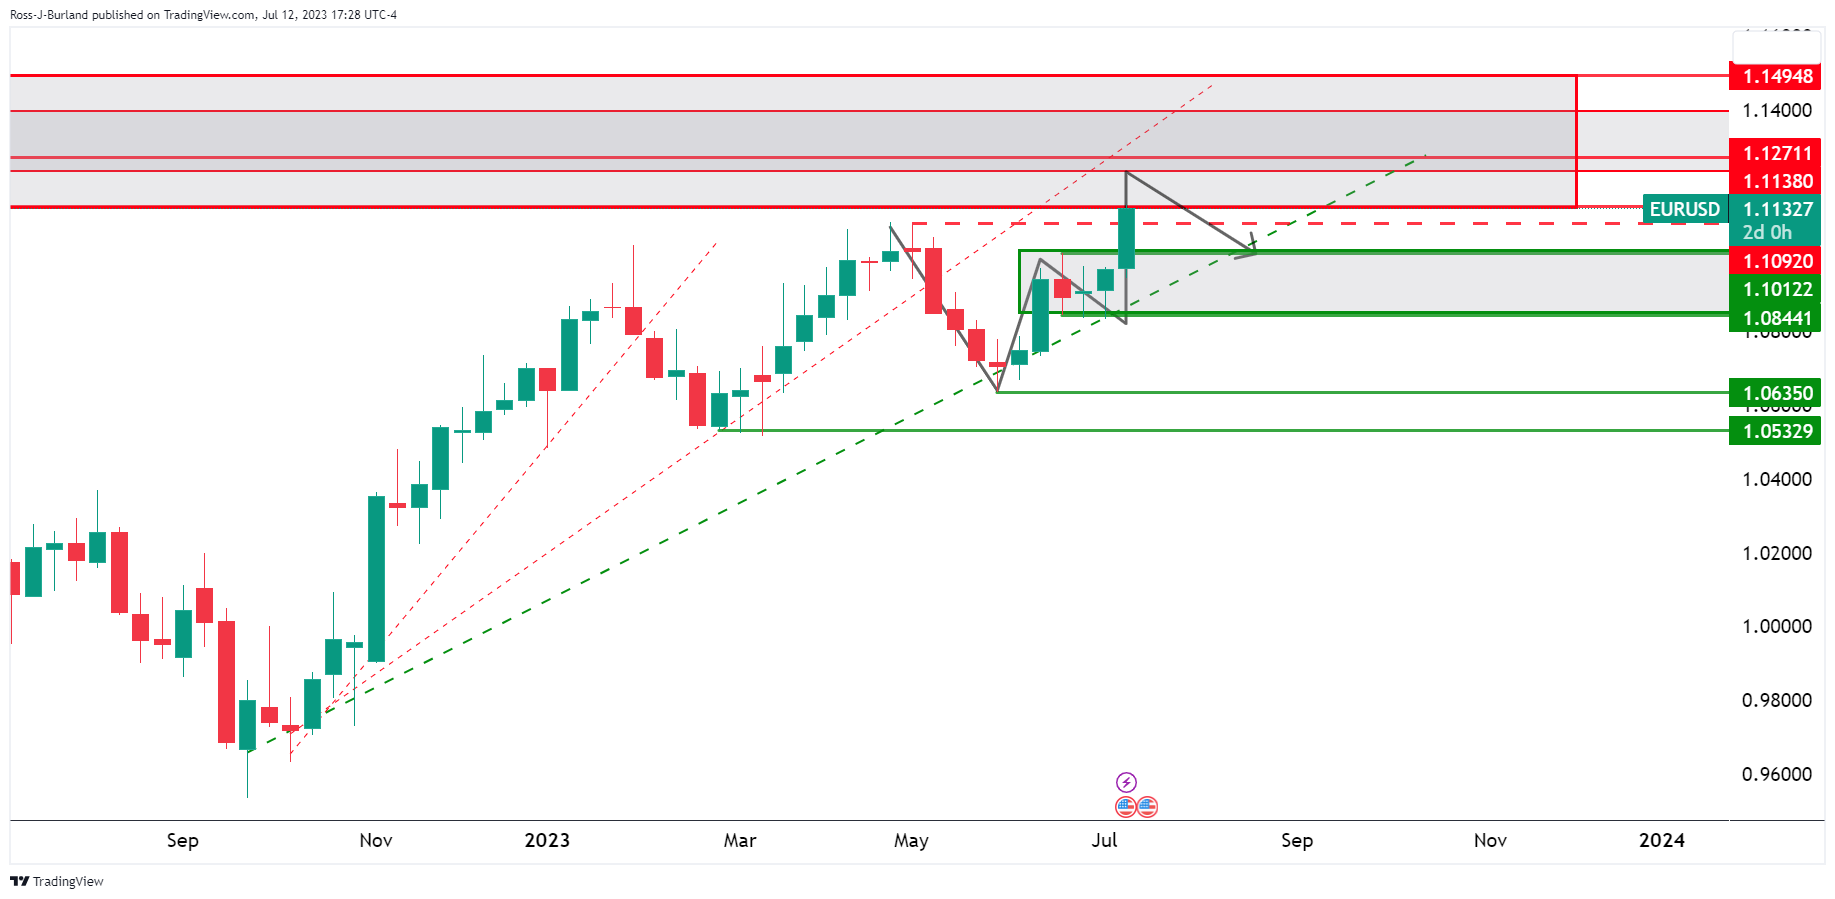
EUR/USD daily chart

The daily chart shows the price leaving behind a W-formation, again, a bearish factor on the charts and a correction could be on the cards with the 38.2% ratio currently lining up with prior resistance.
EUR/USD H4 chart
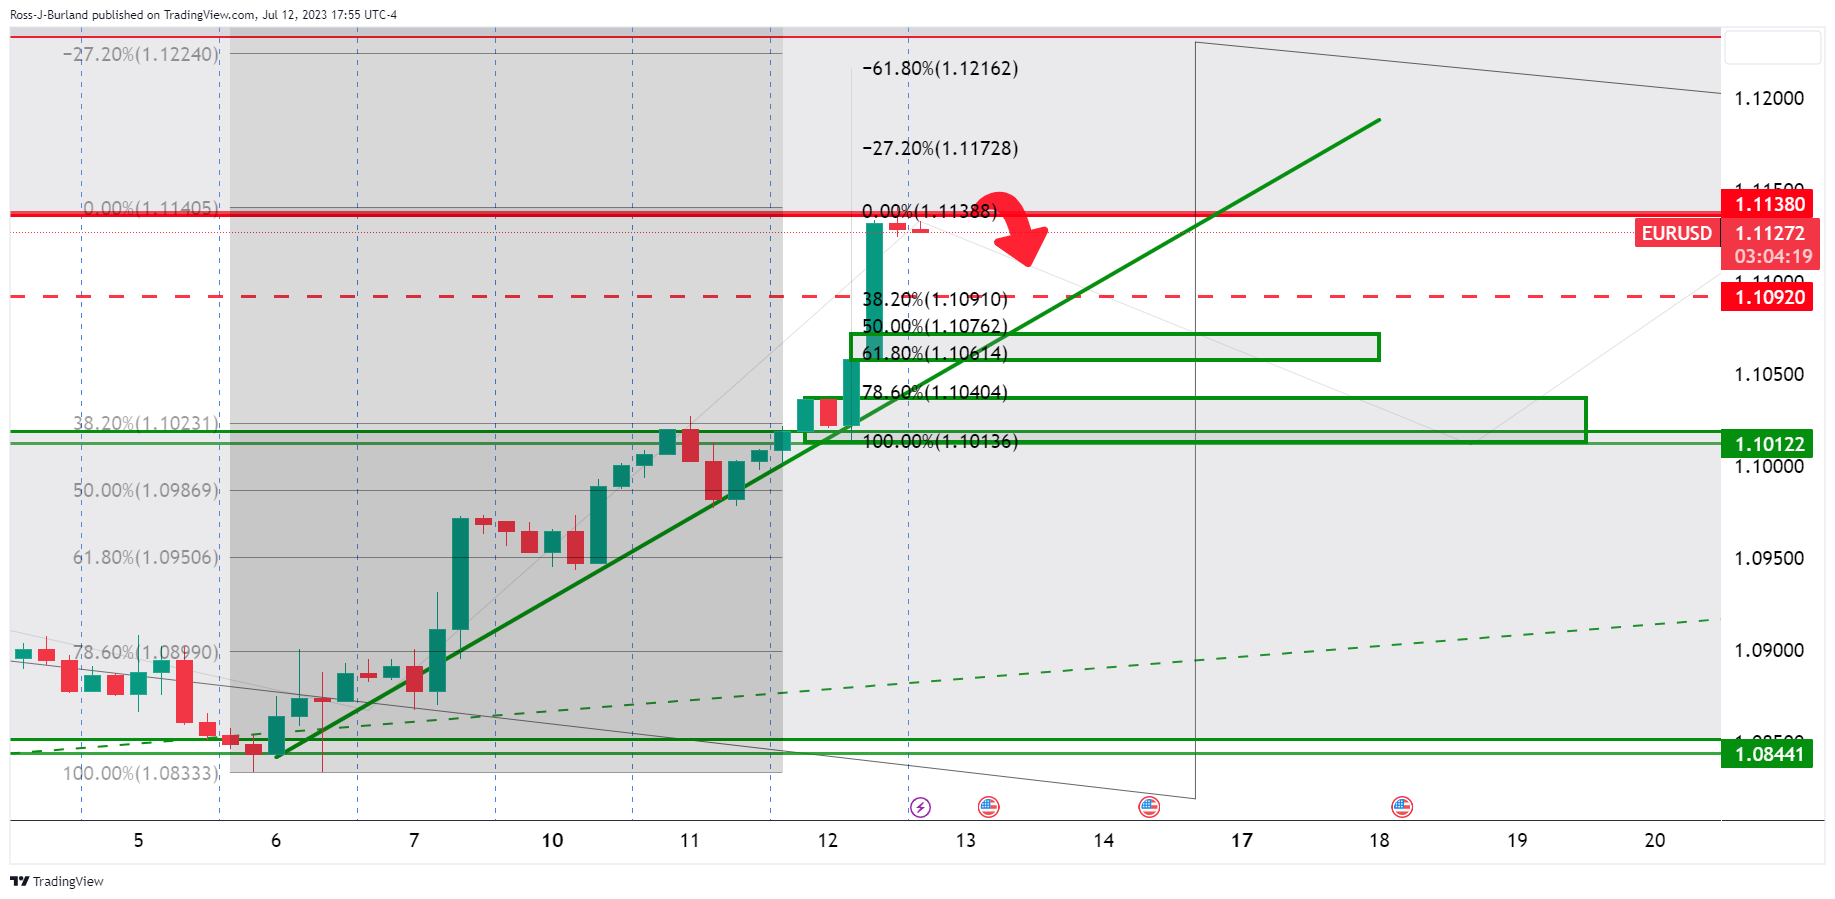
This is where we are going to see the signs of deceleration as we move into Thursday. On the lower time frames, such as the 15 minutes, this will be even more evident and we can start to draw our key support areas as follows:
EUR/USD M15 chart
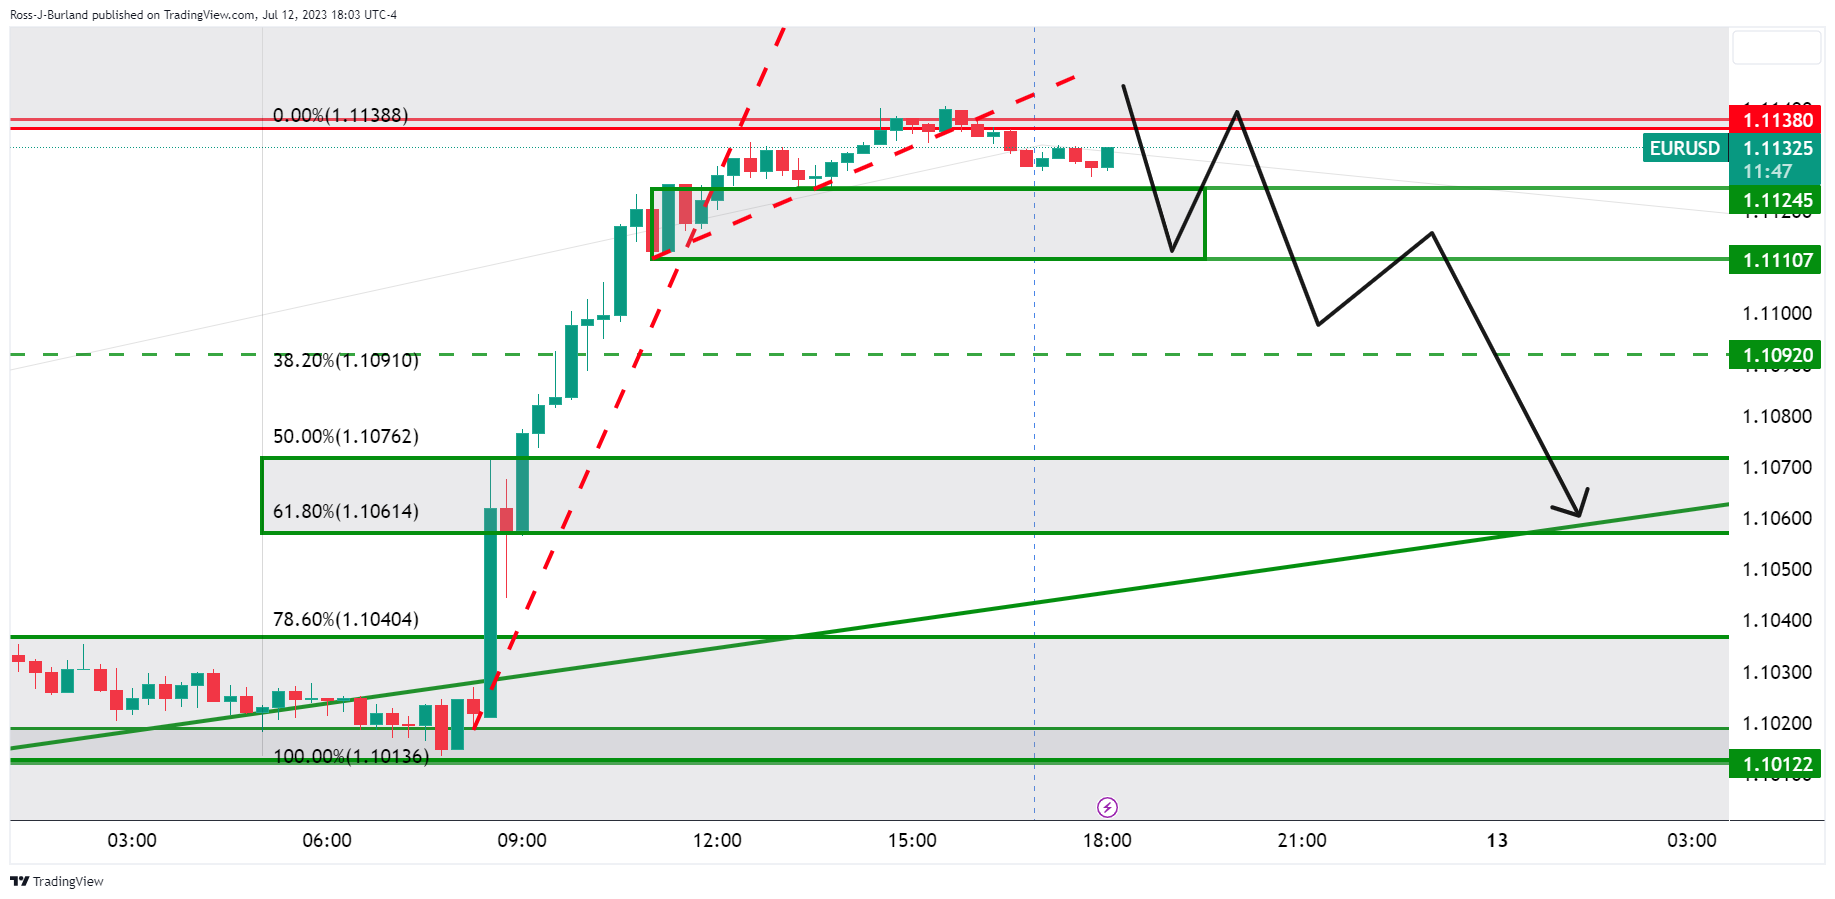
The price is moving into a potential distribution phase and a break of 1.1110/1.1090 could lead to a sell-off towards the trendline support and a 61.8% Fibonacci ratio.