- Natural Gas Price Analysis: Flirts with multi-week descending channel resistance near $2.60
Notícias do Mercado
Natural Gas Price Analysis: Flirts with multi-week descending channel resistance near $2.60
- Natural Gas price oscillates in a narrow trading band through the early European session.
- The descending trend-channel resistance continues to cap the upside for the commodity.
- The technical setup favours bulls and supports prospects for an eventual upside breakout.
Natural Gas price struggles to capitalize on the previous day's strong move up and oscillates in a narrow trading band, around the $2.60 region through the early European session on Wednesday.
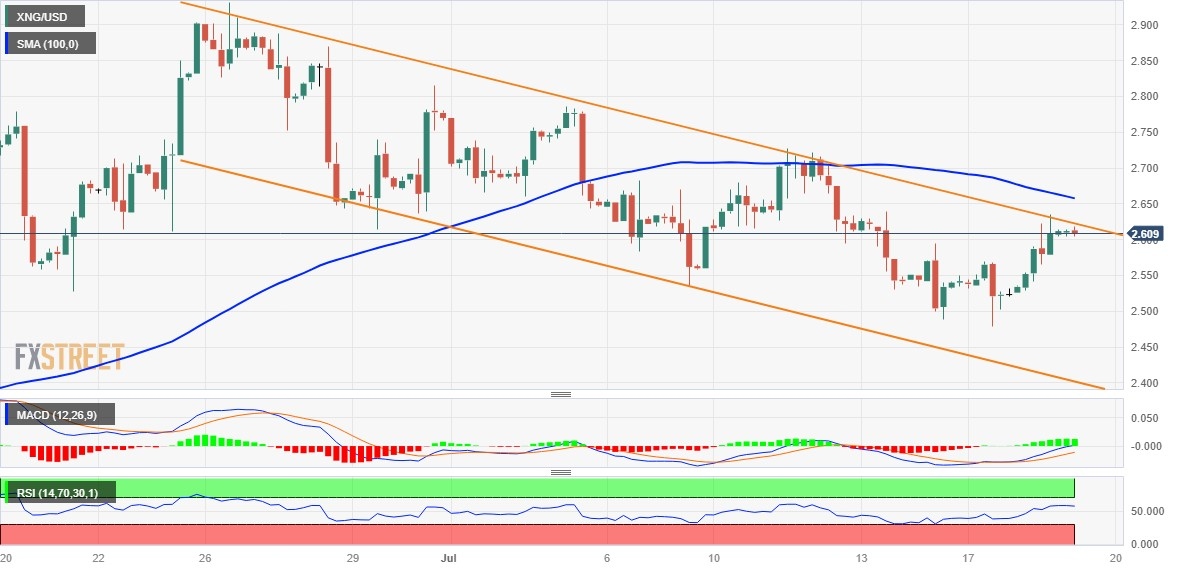
The said area represents the top boundary of a downward-sloping channel extending from the June monthly swing high and should act as a pivotal point. This is followed by the 100-period Simple Moving Average (SMA), currently around the $2.65 region, which if cleared will suggest that the descending trend witnessed over the past three weeks or so has run its course and pave the way for further gains.
Given that technical indicators on daily/4-hour charts are holding in the positive territory, the XNG/USD might then accelerate the momentum towards the $2.725-$2.750 en route to the monthly peak, around the $2.785 zone. The upward trajectory could eventually lift the commodity beyond the $2.815 hurdle, towards the $2.850 resistance and the June swing high, just ahead of the $3.00 mark.
On the flip side, the $2.60-$2.595 area could protect the immediate downside, which is closely followed by the $2.570-$2.565 region. Some follow-through selling might expose the monthly low, around the $2.480-$2.475 zone, with some intermediate support near the $2.50 level. The downward trajectory could get extended towards the trend-channel support, currently around the $2.40 zone.
XNG/USD 4-hour chart