- Natural Gas Price Analysis: XNG/USD sellers challenge two-month-old triangle, focus on $2.59
Notícias do Mercado
Natural Gas Price Analysis: XNG/USD sellers challenge two-month-old triangle, focus on $2.59
- Natural Gas Price remains on the back foot for the second consecutive day within two-month-old symmetrical triangle.
- 50-EMA, stated triangle’s bottom line prod XNG/USD bears.
- Natural Gas buyers need validation from $2.77 for conviction.
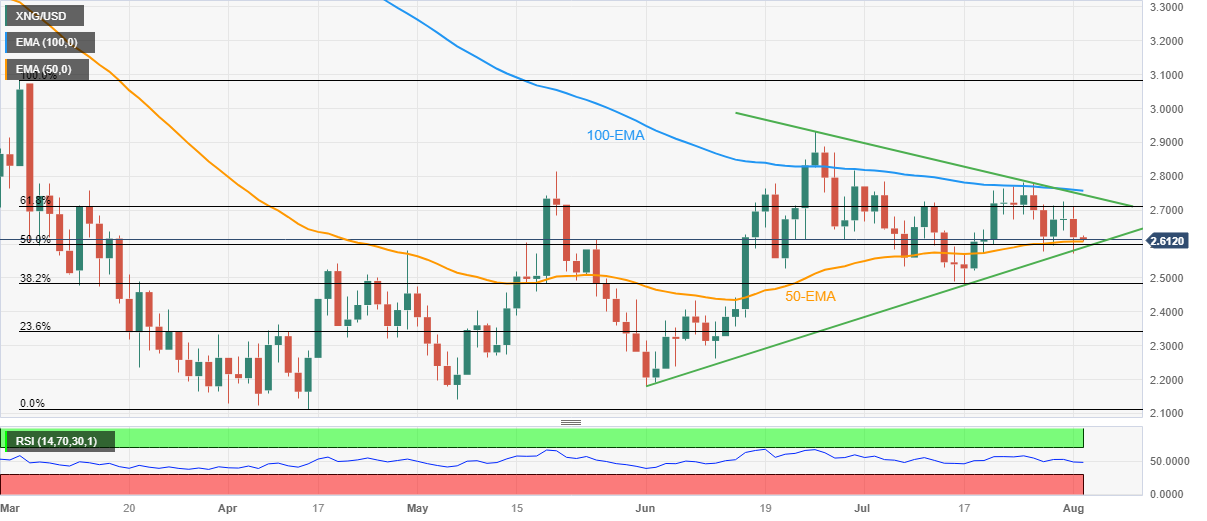
Natural Gas Price (XNG/USD) prints mild gains around $2.61 heading into Wednesday’s European session as sellers attack the key support amid a broad risk-off mood due to the US credit rating downgrade.
That said, a downward-sloping RSI (14) line, not oversold and stays near 50.00, joins the XNG/USD’s failure to keep the previous day’s rebound from the 50-day Exponential Moving Average (EMA) to favor the sellers.
However, a bottom line of the symmetrical triangle comprising levels marked since early June, close to $2.59 at the latest, appears the key to letting the Natural Gas sellers sneak in. Ahead of that the 50-EMA level of $2.60 limits the immediate downside of the XNG/USD.
In a case where the energy instrument drops below $2.59, the odds of witnessing a slump toward the previous monthly low of around $2.47 can’t be ruled out.
However, multiple levels marked around $2.35-30 may challenge the XNG/USD before directing the sellers toward the yearly low reported in April around $2.11.
On the flip side, the 61.8% Fibonacci retracement of the XNG/USD’s downturn from March to April, near $2.71, holds the gate for the buyer’s entry.
Even so, the aforementioned triangle’s top line, near $2.74 at the latest, precedes the 100-EMA hurdle of around $2.75 to challenge the Natural Gas bull before giving them control.
Natural Gas Price: Daily chart
Trend: Further downside expected