- USD/MXN Price Analysis: Flirts with 100-hour SMA/38.2% Fibo. confluence around 17.10 area
Notícias do Mercado
USD/MXN Price Analysis: Flirts with 100-hour SMA/38.2% Fibo. confluence around 17.10 area
- USD/MXN attracts fresh buying on Tuesday and stalls its corrective slide from the monthly top.
- The technical setup favours bullish traders and supports prospects for further intraday gains.
- A sustained break below the 17.00 round-figure mark is needed to negate the positive outlook.
The USD/MXN pair regains positive traction during the Asian session on Tuesday and for now, seems to have snapped a two-day losing streak, stalling its pullback from the 17.4275 area or a nearly two-month touched last week. Spot prices currently trade around just above the 17.10 level, up over 0.25% for the day.
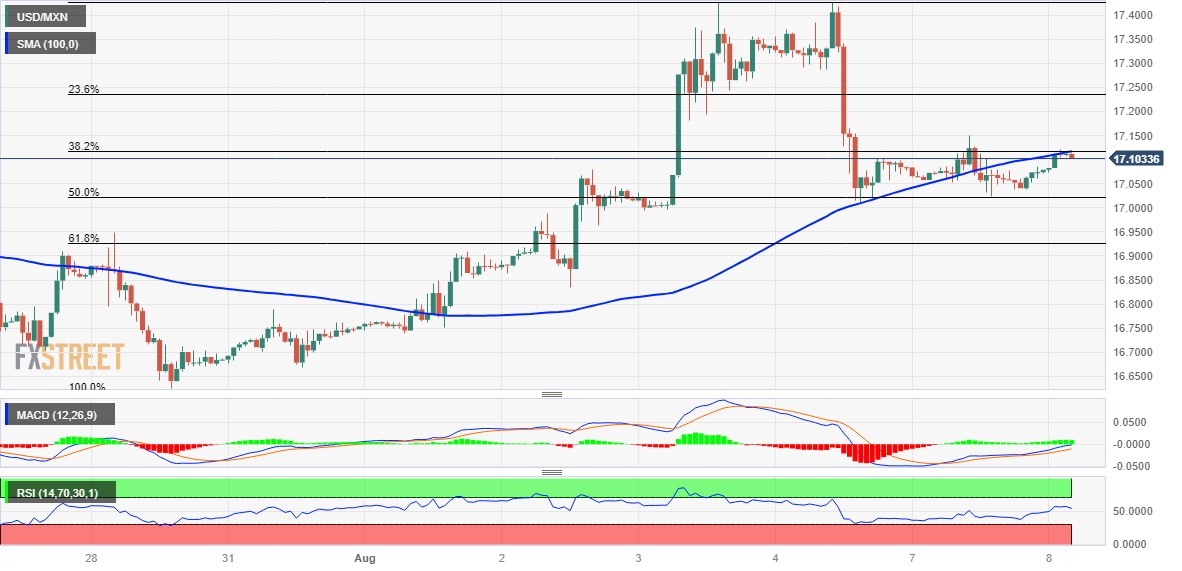
The latter represents the 38.2% Fibonacci retracement level of the recent goodish bounce from a multi-year trough and coincides with the 100-hour Simple Moving Average (SMA). Meanwhile, technical indicators have just started gaining positive traction on daily/hourly charts. Hence, a sustained strength beyond the said confluence hurdle will be seen as a fresh trigger for bulls and pave the way for some meaningful intraday appreciating move for the USD/MXN pair.
Spot priced might then aim to surpass the overnight swing high, around the 17.1505 area and accelerate the positive momentum towards testing the 17.2350 region, or 23.6% Fibo. level. Some follow-through buying has the potential to lift the USD/MXN pair further towards the next relevant resistance near the 17.3650 supply zone en route to the monthly peak, around the 17.4275 zone touched last Friday.
On the flip side, the 17.0235-17.0230 region, or the 50% Fibo. level now seems to protect the immediate downside ahead of the 17.00 round-figure mark. This is followed by the 61.8% Fibo. level, around the 16.9270 area, which if broken decisively will shift the bias in favour of bearish traders and drag the USD/MXN pair to the 16.7950-16.7900 intermediate support en route to the multi-year low, around the 16.6260-16.6250 area touched in July.
USD/MXN 1-hour chart
Key levels to watch