- AUD/USD Price Analysis: Recovers some lost ground near 0.6470 following Australian CPI
Notícias do Mercado
AUD/USD Price Analysis: Recovers some lost ground near 0.6470 following Australian CPI
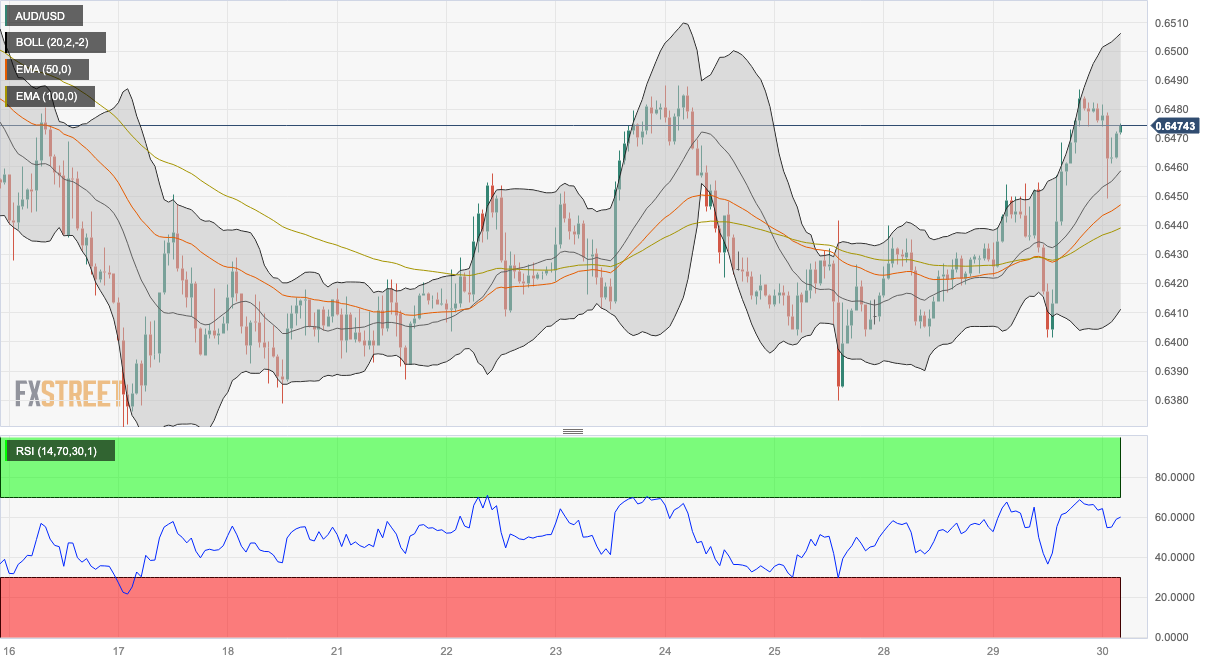
- AUD/USD holds above the 50- and 100-hour EMAs with an upward slope.
- The Relative Strength Index (RSI) stands in bullish territory above 50.
- The immediate resistance level is seen at 0.6485; 0.6445 acts as the initial support level.
The AUD/USD pair recovers some lost ground near 0.6470 after retracing to the 0.6450 low during the early European session on Wednesday. The Australian Dollar (AUD) is under pressure after the monthly Consumer Price Index (CPI) revealed that inflation dropped to a 17-month low in July. This number might convince the Reserve Bank of Australia (RBA) to keep interest rates unchanged in the next policy meeting.
Technically, the AUD/USD pair trades above the 50- and 100-hour Exponential Moving Averages (EMAs) with an upward slope on the one-hour chart, indicating that the path of least resistance for the pair is to the upside.
It’s worth noting that the Relative Strength Index (RSI) stands in bullish territory above 50, challenging the pair’s immediate upside for the time being.
The immediate resistance level for AUD/USD is seen near a high of August 29 at 0.6485. Further north, the 0.6500-0.6505 regions appear a tough nut to crack for Aussie bears. The mentioned level represents the confluence of a psychological round mark, the upper boundary of Bollinger Band, and high of August 14. Any meaningful follow-through buying above the latter could pave the way to 0.6522 (high of August 15) and 0.6570 (high of August 9).
On the downside, the 50-hour EMA at 0.6445 acts as the initial support level for the pair. The additional downside filter to watch is seen at 0.6439 (100-hour EMA). Any intraday pullback below the latter would expose the next contention level at 0.6410 (the lower limit of the Bollinger Band). A decisive breach of the latter will see the next stop at 0.6380 (low of August 25) and finally at 0.6365 (low of August 17).
AUD/USD one-hour chart
