- USD/MXN Price Analysis: Well bid near three-month top, seems poised to appreciate further
Notícias do Mercado
USD/MXN Price Analysis: Well bid near three-month top, seems poised to appreciate further
- USD/MXN scales higher for the sixth straight day and touches a three-month high on Thursday.
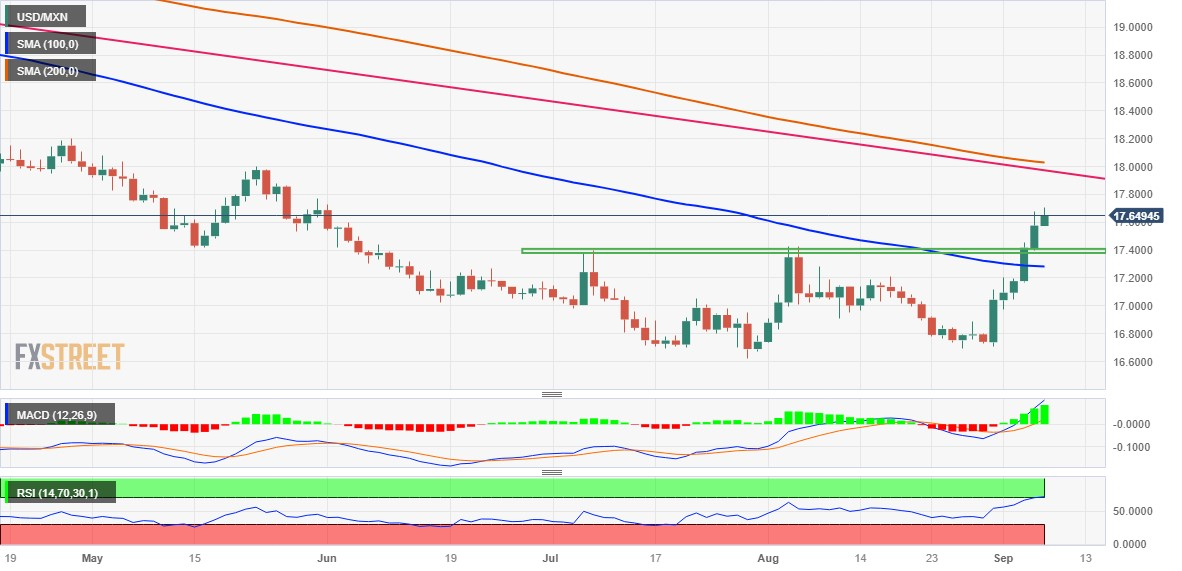
- The recent breakout through the 100-day SMA and the 17.40-45 hurdle favour bullish traders.
- The slightly overbought RSI on the daily chart is seen as the only factor capping further gains.
The USD/MXN pair gains strong positive traction for the sixth successive day on Thursday and jumps to over a three-month top during the early part of the European session. Spot prices, however, retreat a few pips in the last hour and currently trade near the 17.65 region, still up nearly 0.40% for the day.
From a technical perspective, this week's sustained move and acceptance above the 100-day Simple Moving Average (SMA), for the first time since September 2022, was seen as a fresh trigger for bullish traders. A subsequent breakout through the 17.40-17.45 strong horizontal barrier prompted some follow-through technical buying and might have already set the stage for a further near-term appreciating move.
That said, the Relative Strength Index (RSI) on the daily chart is already flashing overbought conditions and makes it prudent to wait for some near-term consolidation or a modest pullback before placing fresh bets. Nevertheless, the USD/MXN pair seems poised to build on its sharp rise witnessed over the past week or so and aim to challenge the very important 200-day SMA, currently around the 18.00 mark.
The said handle coincides with a downward sloping trend-line extending from the September 2022 swing high and should act as a key pivotal point, which if cleared decisively should pave the way for additional gains.
On the flip side, any meaningful corrective slide below the daily trough, around the 17.60-17.55 region, could be seen as a buying opportunity and remain limited near the 17.45-17.40 resistance breakpoint. This is closely followed by the 100-day SMA, around the 17.30-17.25 zone. Failure to defend the said support levels might prompt some technical selling and drag the USD/MXN pair back towards the 17.00 round figure.
USD/MXN daily chart

Technical levels to watch