- AUD/JPY Price Analysis: Bears seize control, reclaim the 20-day SMA
Notícias do Mercado
AUD/JPY Price Analysis: Bears seize control, reclaim the 20-day SMA
- The AUD/JPY currently trades at 97.42, undergoing a 0.43% loss in Thursday's trading session.
- The daily chart shows a shift in RSI from positive to negative territory.
- If the AUD/JPY holds above the 100 and 200-day SMA the outlook will still be positive.
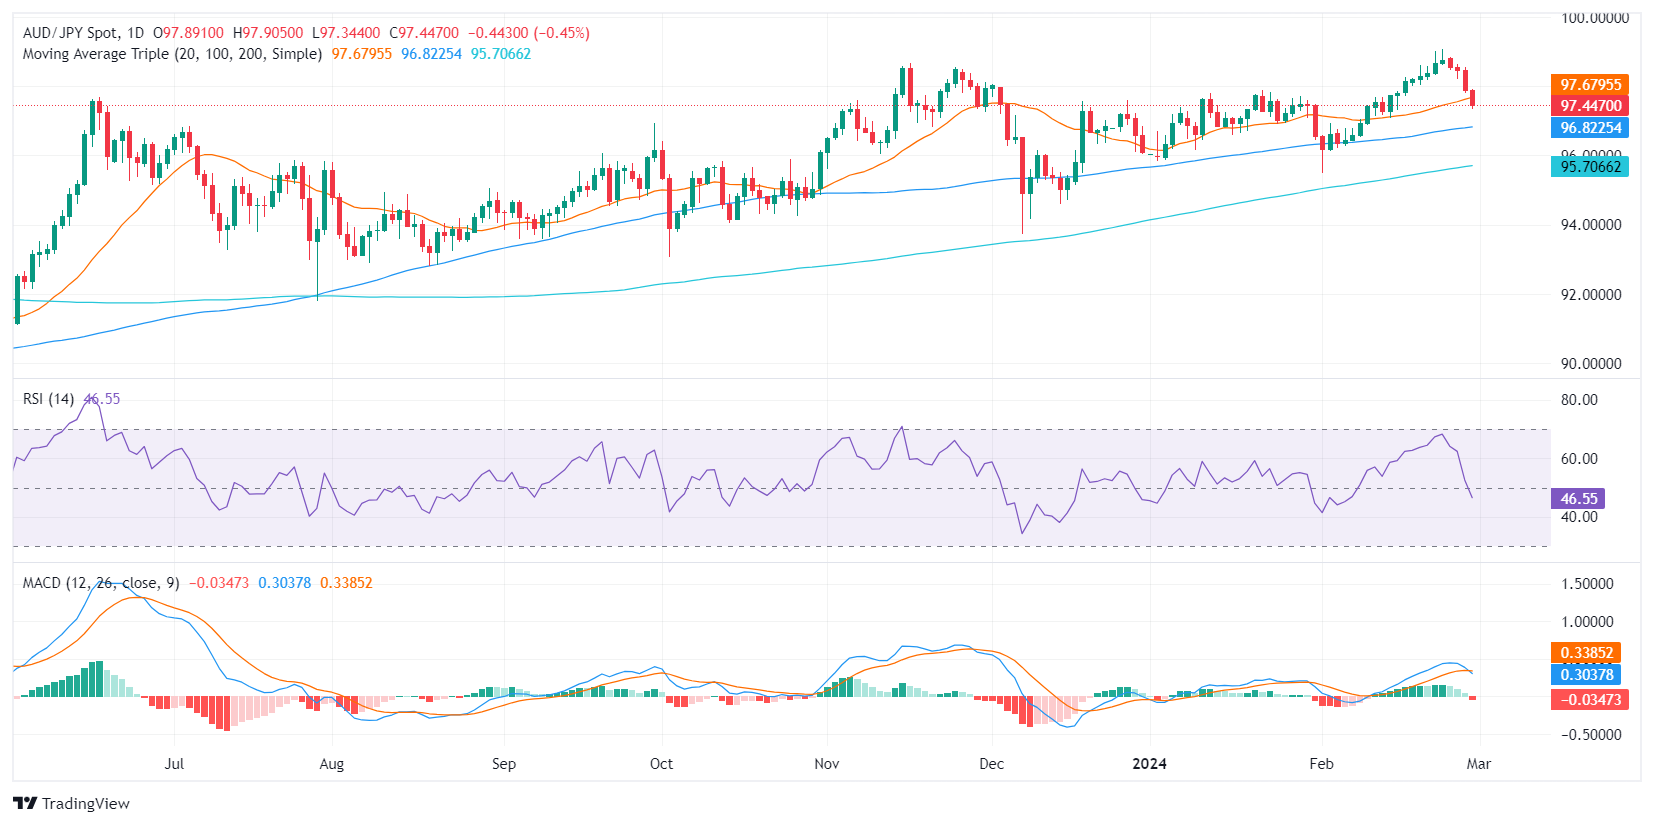
The AUD/JPY pair is currently trading at 97.42, marking a 0.43% loss. The pair is navigating moderate selling pressure, suggesting control from the sellers' side, albeit the bulls maintaining ground as the pair stands above key Simple Moving Averages (SMAs).
Considering the daily Relative Strength Index (RSI), a downward trend from positive territory into negative was seen. Combined with the rising red bars of the Moving Average Convergence Divergence (MACD) histogram, this indicates a shift in momentum toward sellers. Despite previously maintaining strength within positive territory, mild signs of price exhaustion emerged after hitting multi-year highs recently.
AUD/JPY daily chart
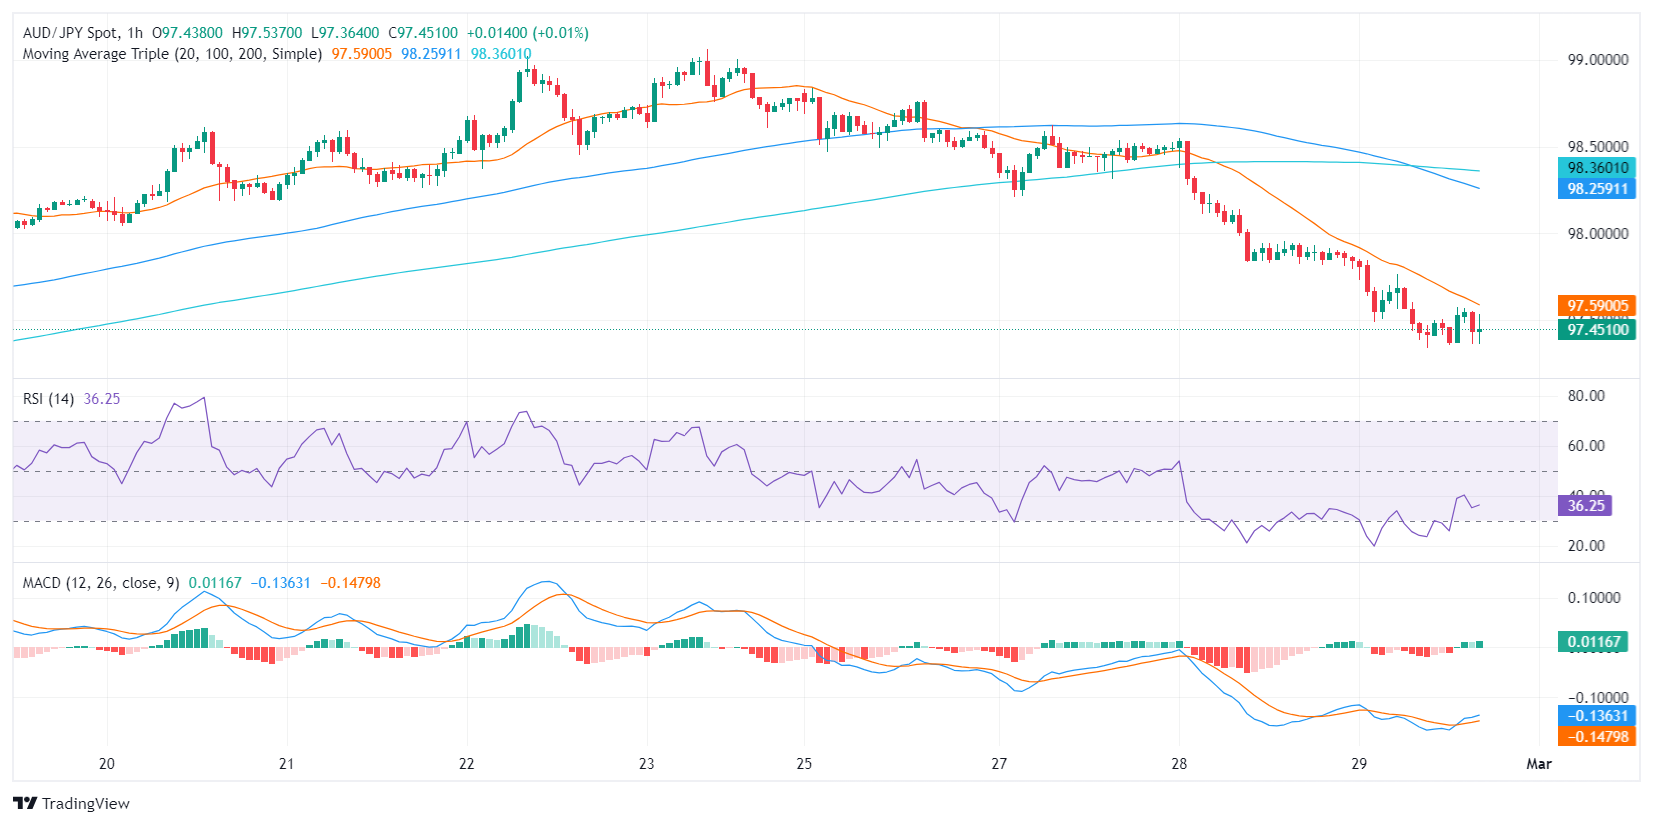
On an hourly chart, the RSI has remained within the negative territory, suggesting sustained selling pressure over the past hours. The MACD histogram, with flat green bars, confirms this bearish signal. A notable divergence between daily and hourly charts occurs, as the former has just entered a negative zone while the latter has been quite negative already. This underlines the speed and intensity of the bearish swing.
AUD/JPY hourly chart
Counterbalancing this pessimistic outlook, the AUD/JPY pair holds above its key 100 and 200-day Simple Moving Averages (SMAs), following the dip under the 20-day SMA. This suggests that despite the sudden bearish inclination, the bulls may not have entirely lost the game yet concerning the longer timeframe.