- USD/JPY Price Analysis: Possibly in a sweet spot for sellers
Notícias do Mercado
USD/JPY Price Analysis: Possibly in a sweet spot for sellers
- USD/JPY rebounds into a key resistance zone after the release of stickier-than-expected US CPI data.
- The pair has hit a tough ceiling where two major moving averages converge.
- USD/JPY is at risk of rolling over and continuing its short-term downtrend.
USD/JPY rebounds after the release of higher-than-forecast US Consumer Price Index (CPI) data for February. The data increases the probability the Federal Reserve will retain interest rates at their current relatively high levels for longer. Higher interest rates are a positive for a currency since they result in higher capital inflows.
USD/JPY has rallied off of the data and run into a substantial resistance zone made up of two major moving averages: the 50 (red) and 100-day (blue) Simple Moving Averages (SMA). Given the overall short-term trend is bearish and still assumed intact, the pullback could provide sellers with the perfect opportunity to short the currency pair.
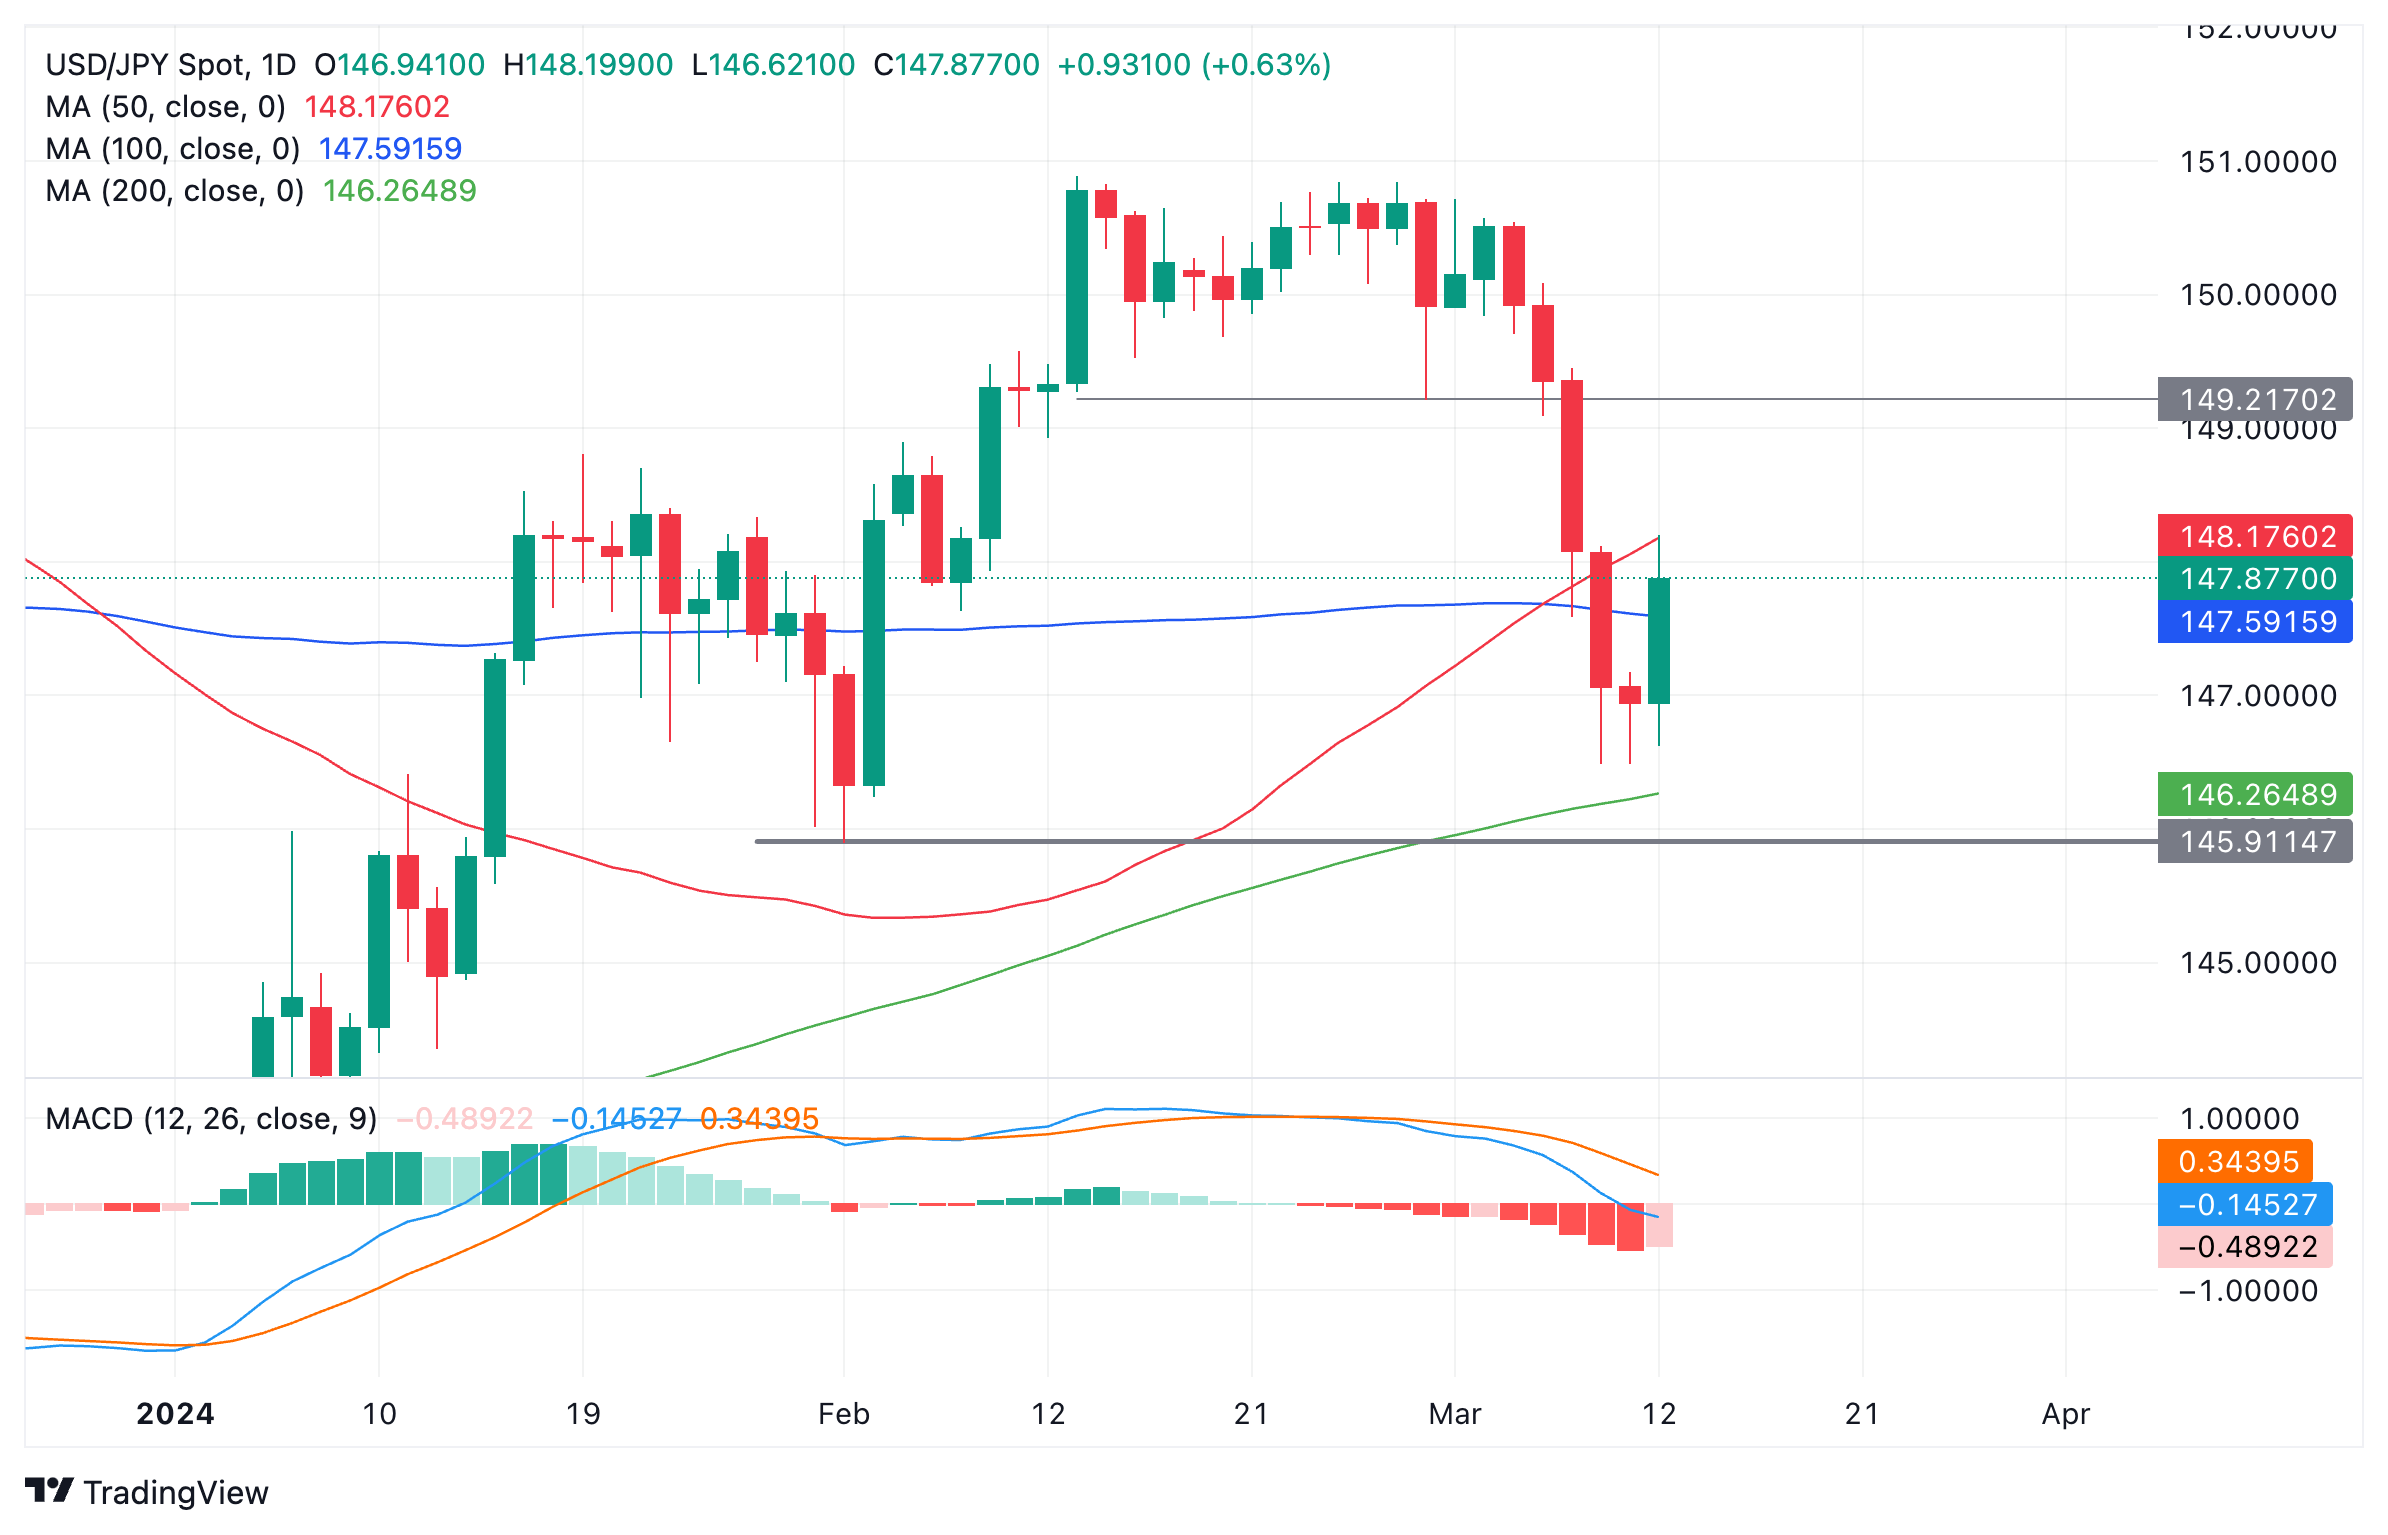
US Dollar vs Japanese Yen: Daily chart
Impact of CPI on US Dollar could be temporary
Although the CPI data beat estimates most of the upside was mainly due to higher Gasoline prices which are seen as a variable inflationary pressure that is less likely to endure. This suggests upside for the US Dollar (USD) – and the USD/JPY – is likely to be tempered and short-lived.
The Yen is supported by expectations and rumors swirling that the Bank of Japan (BoJ) will soon raise its base interest rates from negative levels. Some even hypothesize the country could be exiting the moribund growth trend of the last 30 years. This has been responsible for the USD/JPY’s recent descent.
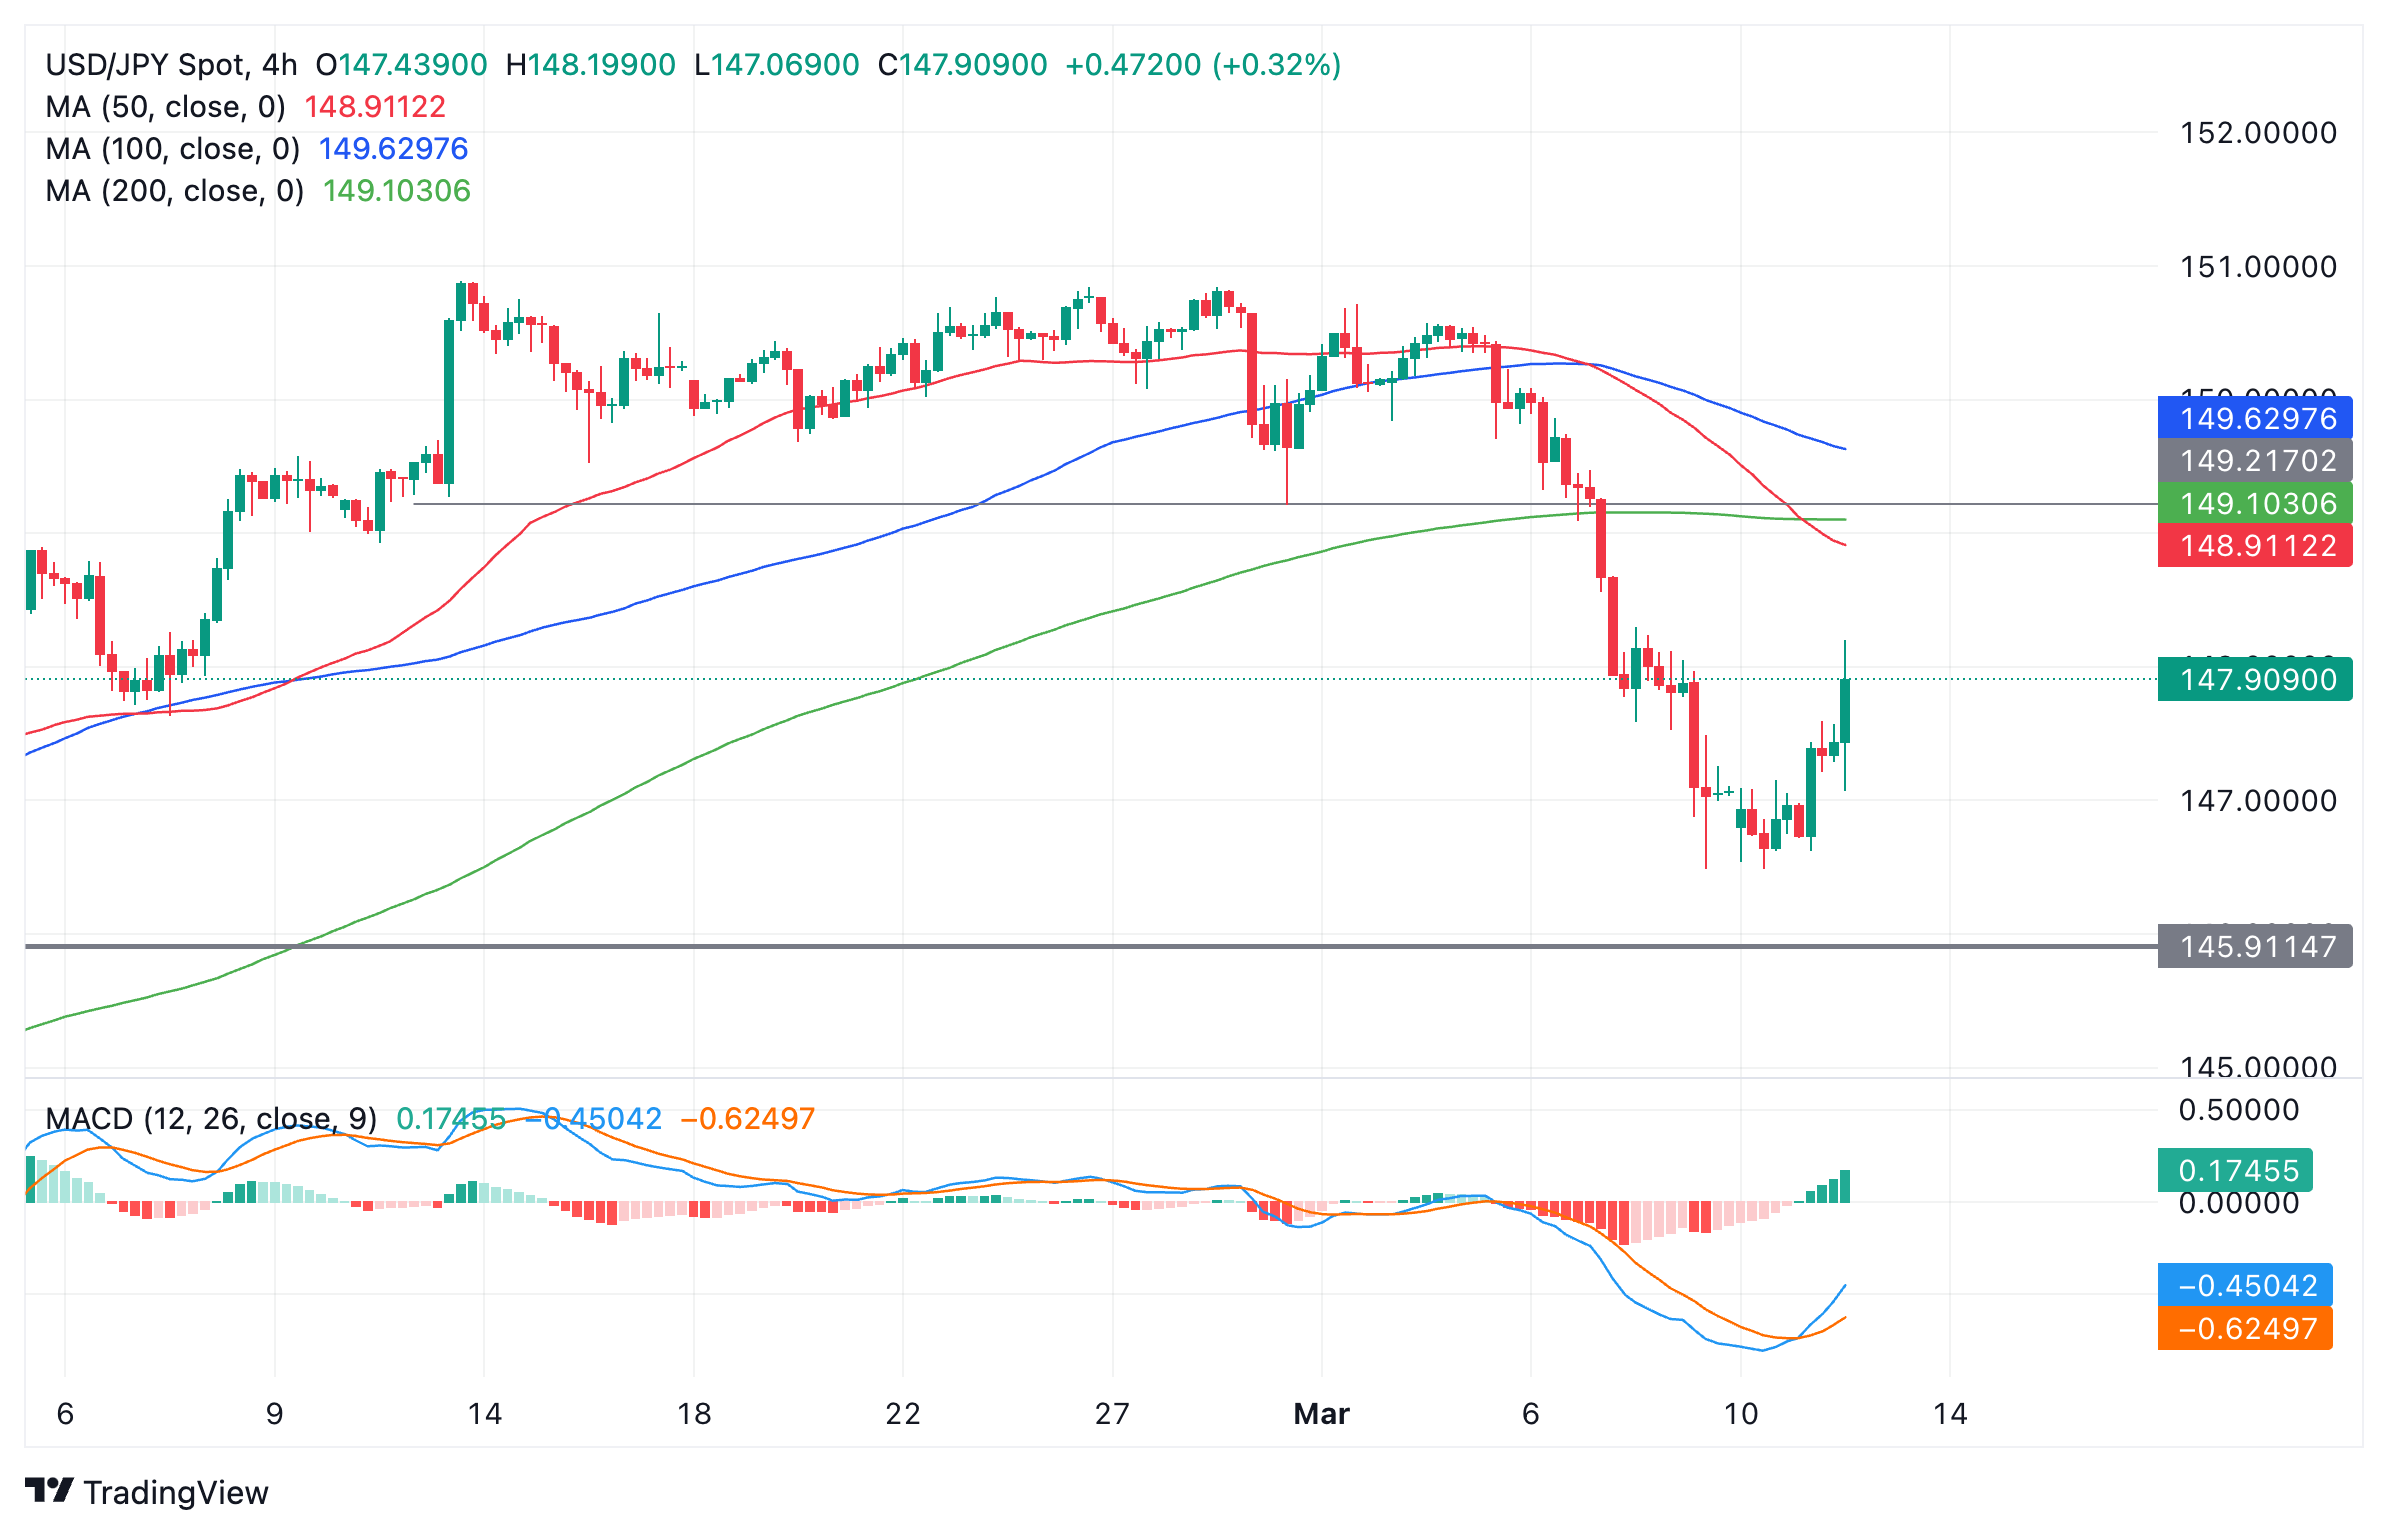
US Dollar vs Japanese Yen: 4-hour chart
Given the pair remains in a short-term downtrend despite the pullback of recent days, it is vulnerable to eventually rolling over and falling again.
There are no indications on the 4-hour chart above that the pullback higher has ended, however, so it remains too early to say with any certainty whether the pair will start going lower again. Some sort of candlestick reversal pattern would ideally form to warn traders of a resumption of downside, but this has not yet happened.
If the pair does revolve lower, however, it is likely to fall back down to the 146.48 March 8 lows.
If USD/JPY breaks below the 146.48 lows it will probably fall to support at the 146.22 and the 200-day SMA, followed by 145.89, the February 1 low.