- NZD/USD Price Analysis: Bearish trend sustains despite upward movements
Notícias do Mercado
NZD/USD Price Analysis: Bearish trend sustains despite upward movements
- The daily RSI and MACD of the NZD/USD highlight a growing buying momentum.
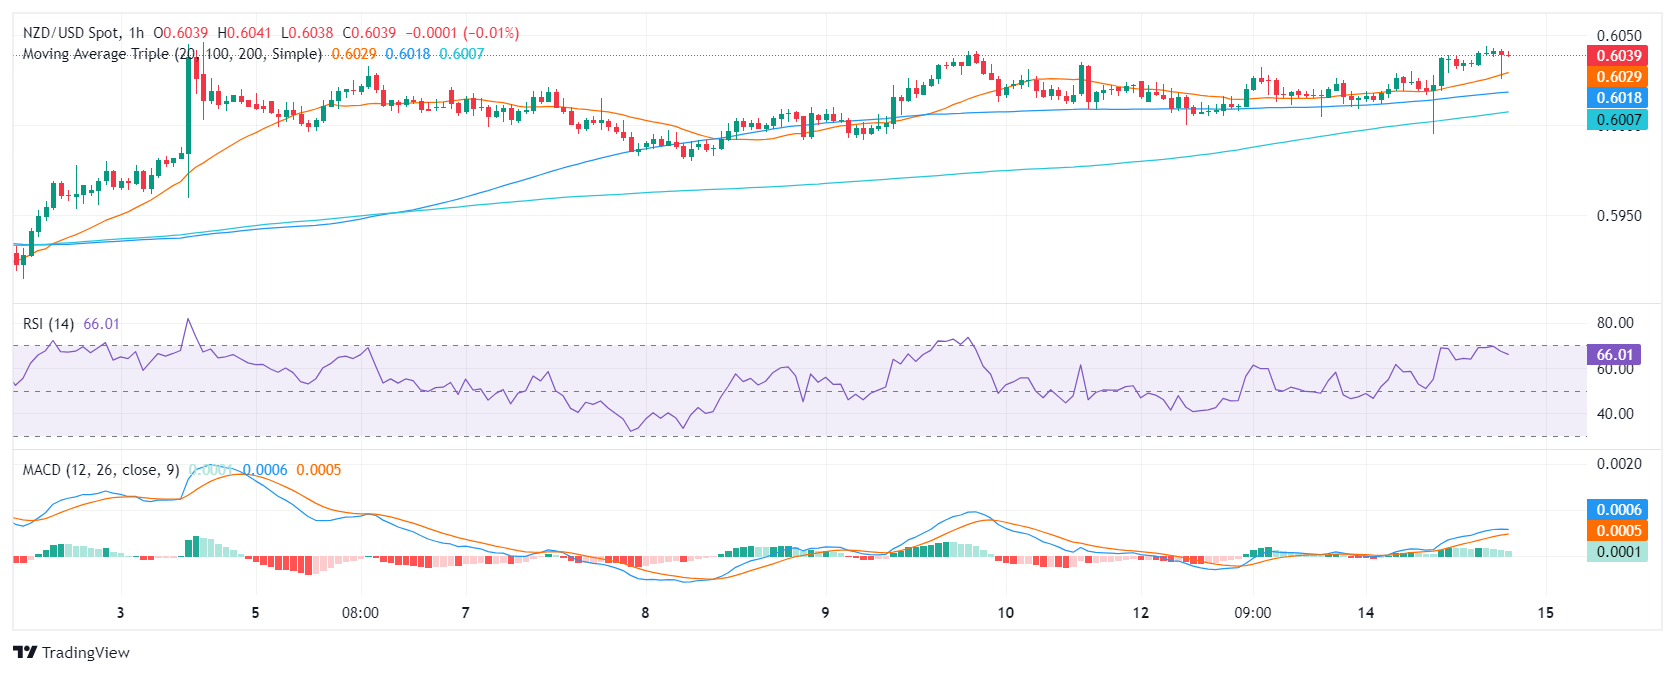
- The hourly RSI and MACD show a gradual reduction in the bullish momentum as indicators neared overbought conditions.
- For further upwards movements, the buyers will need to reclaim the main 200-day SMAs.
On Tuesday, the NZD/USD saw gains but the pair maintains and overall bearish outlook. Despite a marginal recovery challenge to the 200-day Simple Moving Averages (SMA), momentum stays subdued. Should the pair fail to breach the 200-day SMA in the near term, further downward movement might be impending.
The daily Relative Strength Index (RSI) for the NZD/USD pair on the daily chart reflects a positive trend. With the latest reading positioned above the 50 level, the pair is leaning towards positive territory. The Moving Average Convergence Divergence (MACD) exhibits flat green bars which alludes to a continuation of positive momentum, albeit at a stagnant pace.
NZD/USD daily chart

Comparatively, the hourly RSI has shown fluctuations in positive territory on Tuesday, reaching into the overbought region earlier in the session. The hourly MACD presents decreasing green bars, indicating a slow gradual reduction in the positive momentum as investors may be taking profits ahead of the Asian session.
NZD/USD hourly chart

With that said, the overall picture shows a downward inclination for the NZD/USD. Given its status relative to the key SMAs of 100 and 200-day SMAs, market participants shouldn’t consider the latest movements as a buying signal, unless the buyers manage to conquer the 200-day SMA, which would brighten the outlook for the pair.