- EUR/USD Price Analysis: Breaks above descending trend channel, the next barrier is seen above 1.0880
Notícias do Mercado
EUR/USD Price Analysis: Breaks above descending trend channel, the next barrier is seen above 1.0880
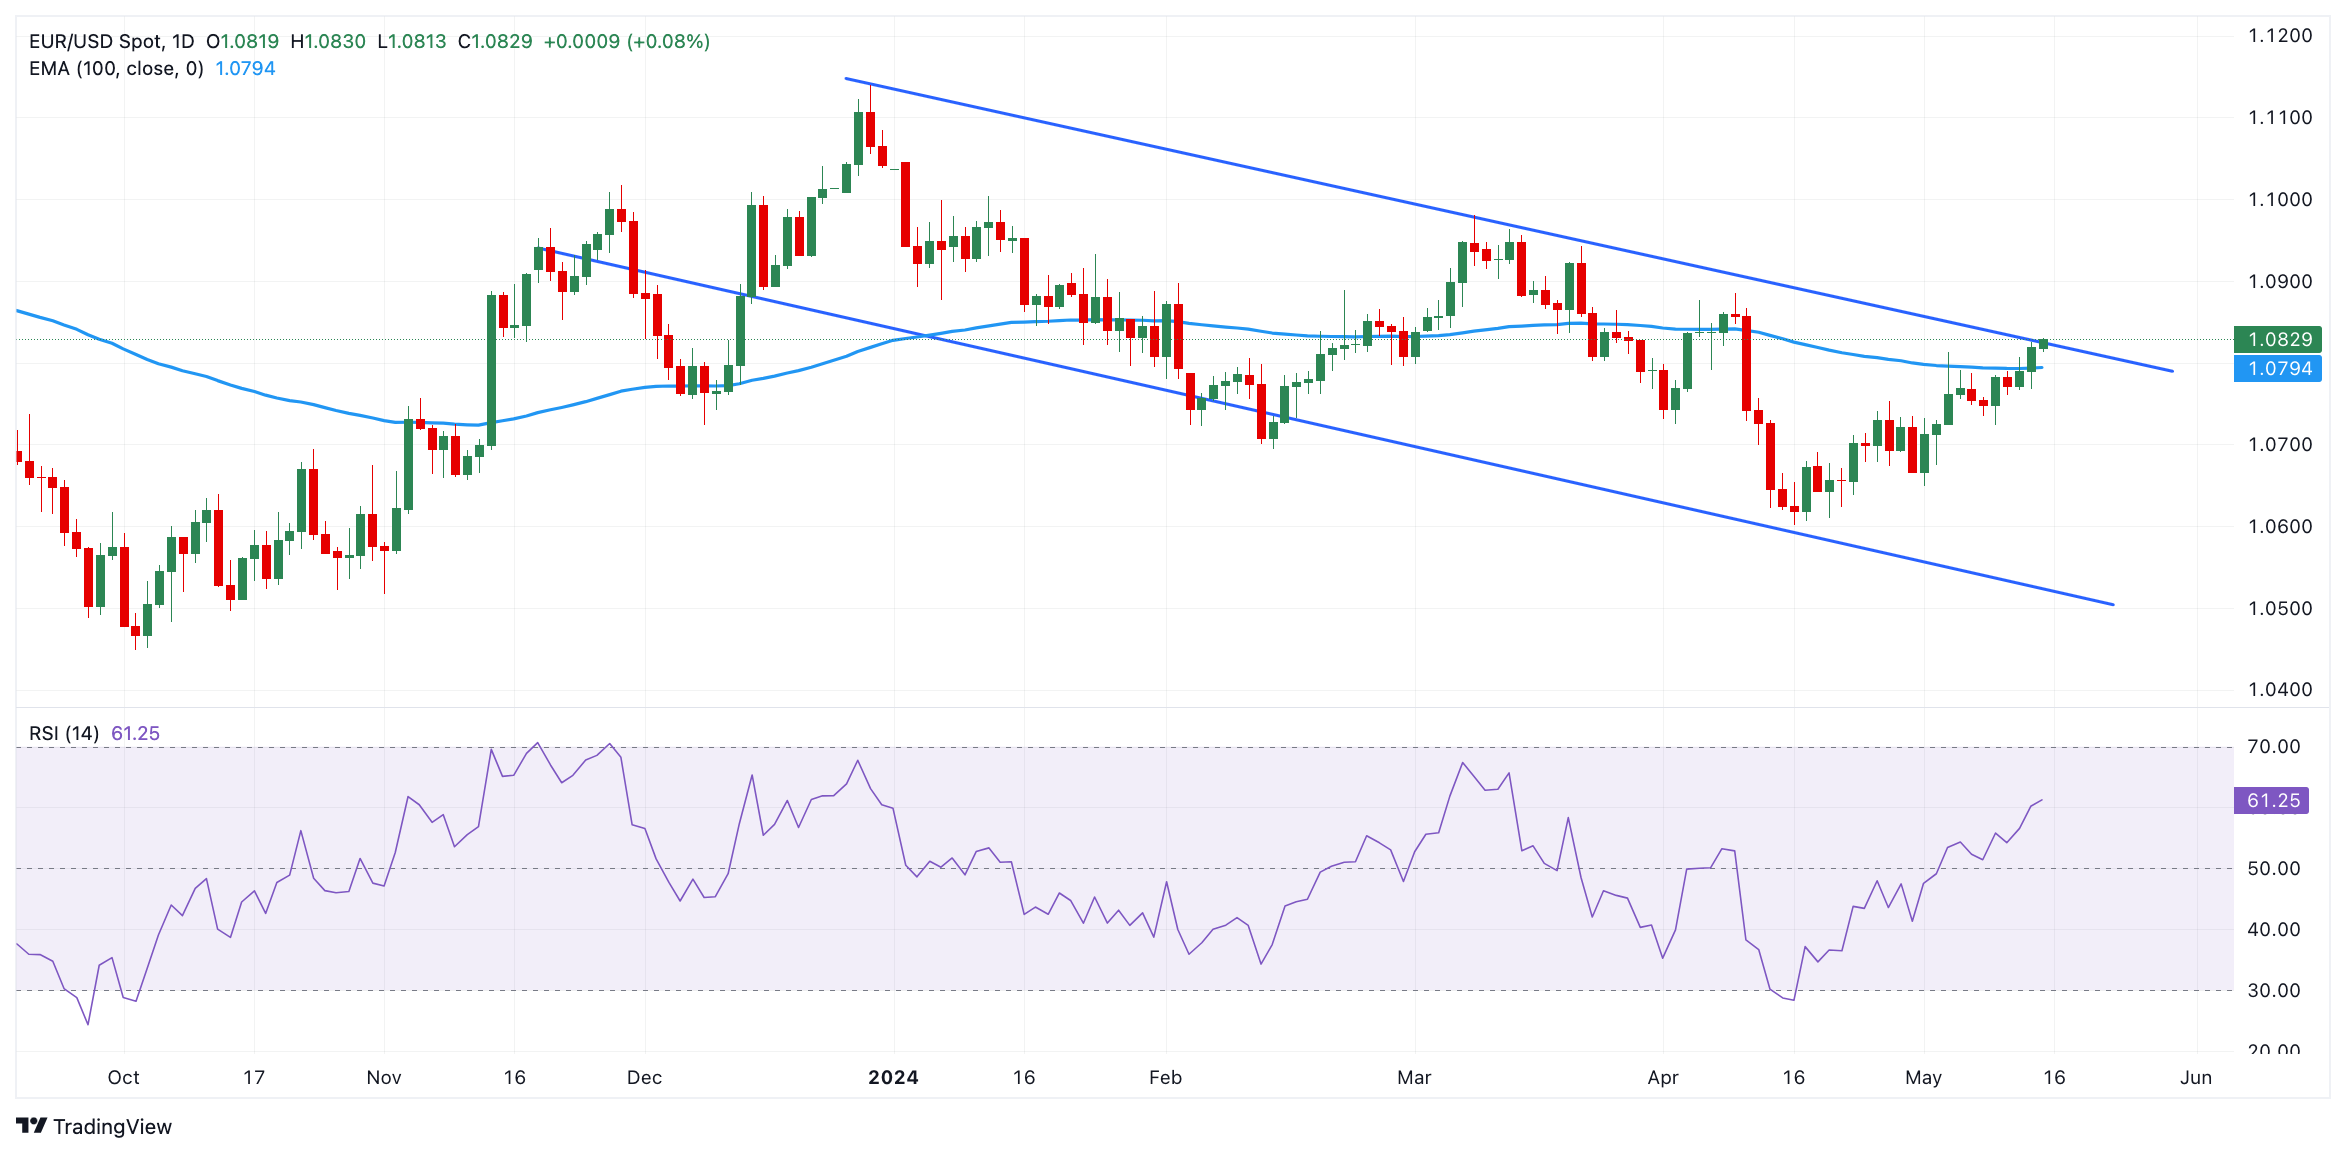
- EUR/USD attracts some buyers to 1.0825 amid weaker USD on Wednesday.
- The pair resumes its upside as it holds above the key EMA; RSI indicator stands in bullish territory.
- The next upside barrier is seen at 1.0885; the first downside target is located at 1.0795.
The EUR/USD pair extends the rally near 1.0825 on Wednesday during the early European trading hours. The uptick of the major pair is bolstered by the upbeat ZEW Economic Sentiment Survey and the softer US Dollar (USD). Investors will closely monitor the Eurozone GDP growth number, which is forecast to grow by 0.3% QoQ in the first quarter of 2024.
According to the daily chart, EUR/USD has remained confined in a descending trend channel since mid-December 2023. The bullish outlook of the major pair resumes as it crosses above the key 100-day Exponential Moving Average (EMA). Additionally, the upward momentum is bolstered by the 14-day Relative Strength Index (RSI) stands in bullish territory around 60.80, indicating that further upside looks favorable.
The major pair breaks above the upper boundary of the descending trend channel and the psychological level of 1.0800. The next resistance level is seen at a high of April 9 at 1.0885. The additional upside filter to watch is a high of March 21 at 1.0943, en route to a high of March 8 at 1.0981, and finally the 1.1000 psychological level.
On the other hand, the first downside target for EUR/USD will emerge near the 100-day EMA at 1.0795. Any follow-through selling below this level will see a drop to a low of May 9 at 1.0724. Further south, the next contention level is located around a low of May 2 at 1.0650, followed by a low of April 16 at 1.0600.
EUR/USD daily chart
