- USD/CAD Price Analysis: Rises to near 1.3750 nearing lower boundary of rising channel
Notícias do Mercado
USD/CAD Price Analysis: Rises to near 1.3750 nearing lower boundary of rising channel
- USD/CAD could test the lower boundary of the rising channel, potentially rebounding to re-enter the rising channel.
- A break below the 50 level on the 14-day RSI could indicate the emergence of a bearish bias.
- The pair may find immediate support at the psychological level of 1.3700 and the 21-day EMA of 1.3697 level.
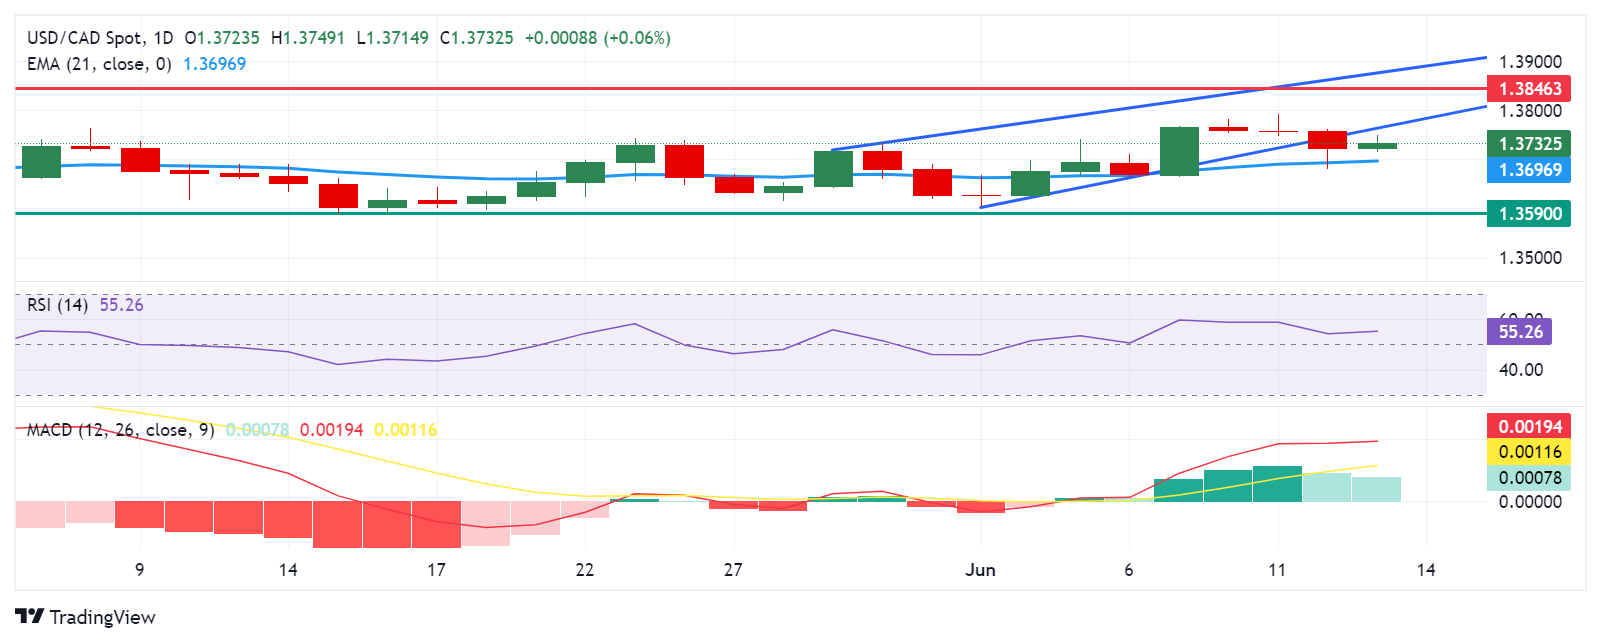
USD/CAD breaks its three-day losing streak, trading around 1.3730 during the European session on Thursday. Analysis of the daily chart suggests a weakening bullish bias for the USD/CAD pair, as it has broken below the rising channel pattern. However, the 14-day Relative Strength Index (RSI) is still positioned slightly above the 50 level. Further movement may give a clear directional indication.
Additionally, the momentum indicator Moving Average Convergence Divergence (MACD) suggests a bullish trend for the pair as the MACD line is positioned above the centerline, it shows divergence above the signal line.
The USD/CAD pair may test the lower boundary of the rising channel around the level of 1.3760, followed by the key barrier at the psychological level of 1.3800. A return to the rising channel could reinforce the bullish bias and support the pair to explore the region April’s high of 1.3846.
A break above the latter could lead the USD/CAD pair to approach the upper threshold of the rising channel around the level of 1.3870.
On the downside, the USD/CAD pair could find immediate support at the psychological level of 1.3700, aligned with the 21-day Exponential Moving Average (EMA) of 1.3697 level. A break below this level could exert pressure on the pair to navigate the region of the throwback support at 1.3590.
USD/CAD: Daily Chart
