- USD/CAD Price Analysis: Breaks out of Symmetrical Triangle pattern
Notícias do Mercado
USD/CAD Price Analysis: Breaks out of Symmetrical Triangle pattern
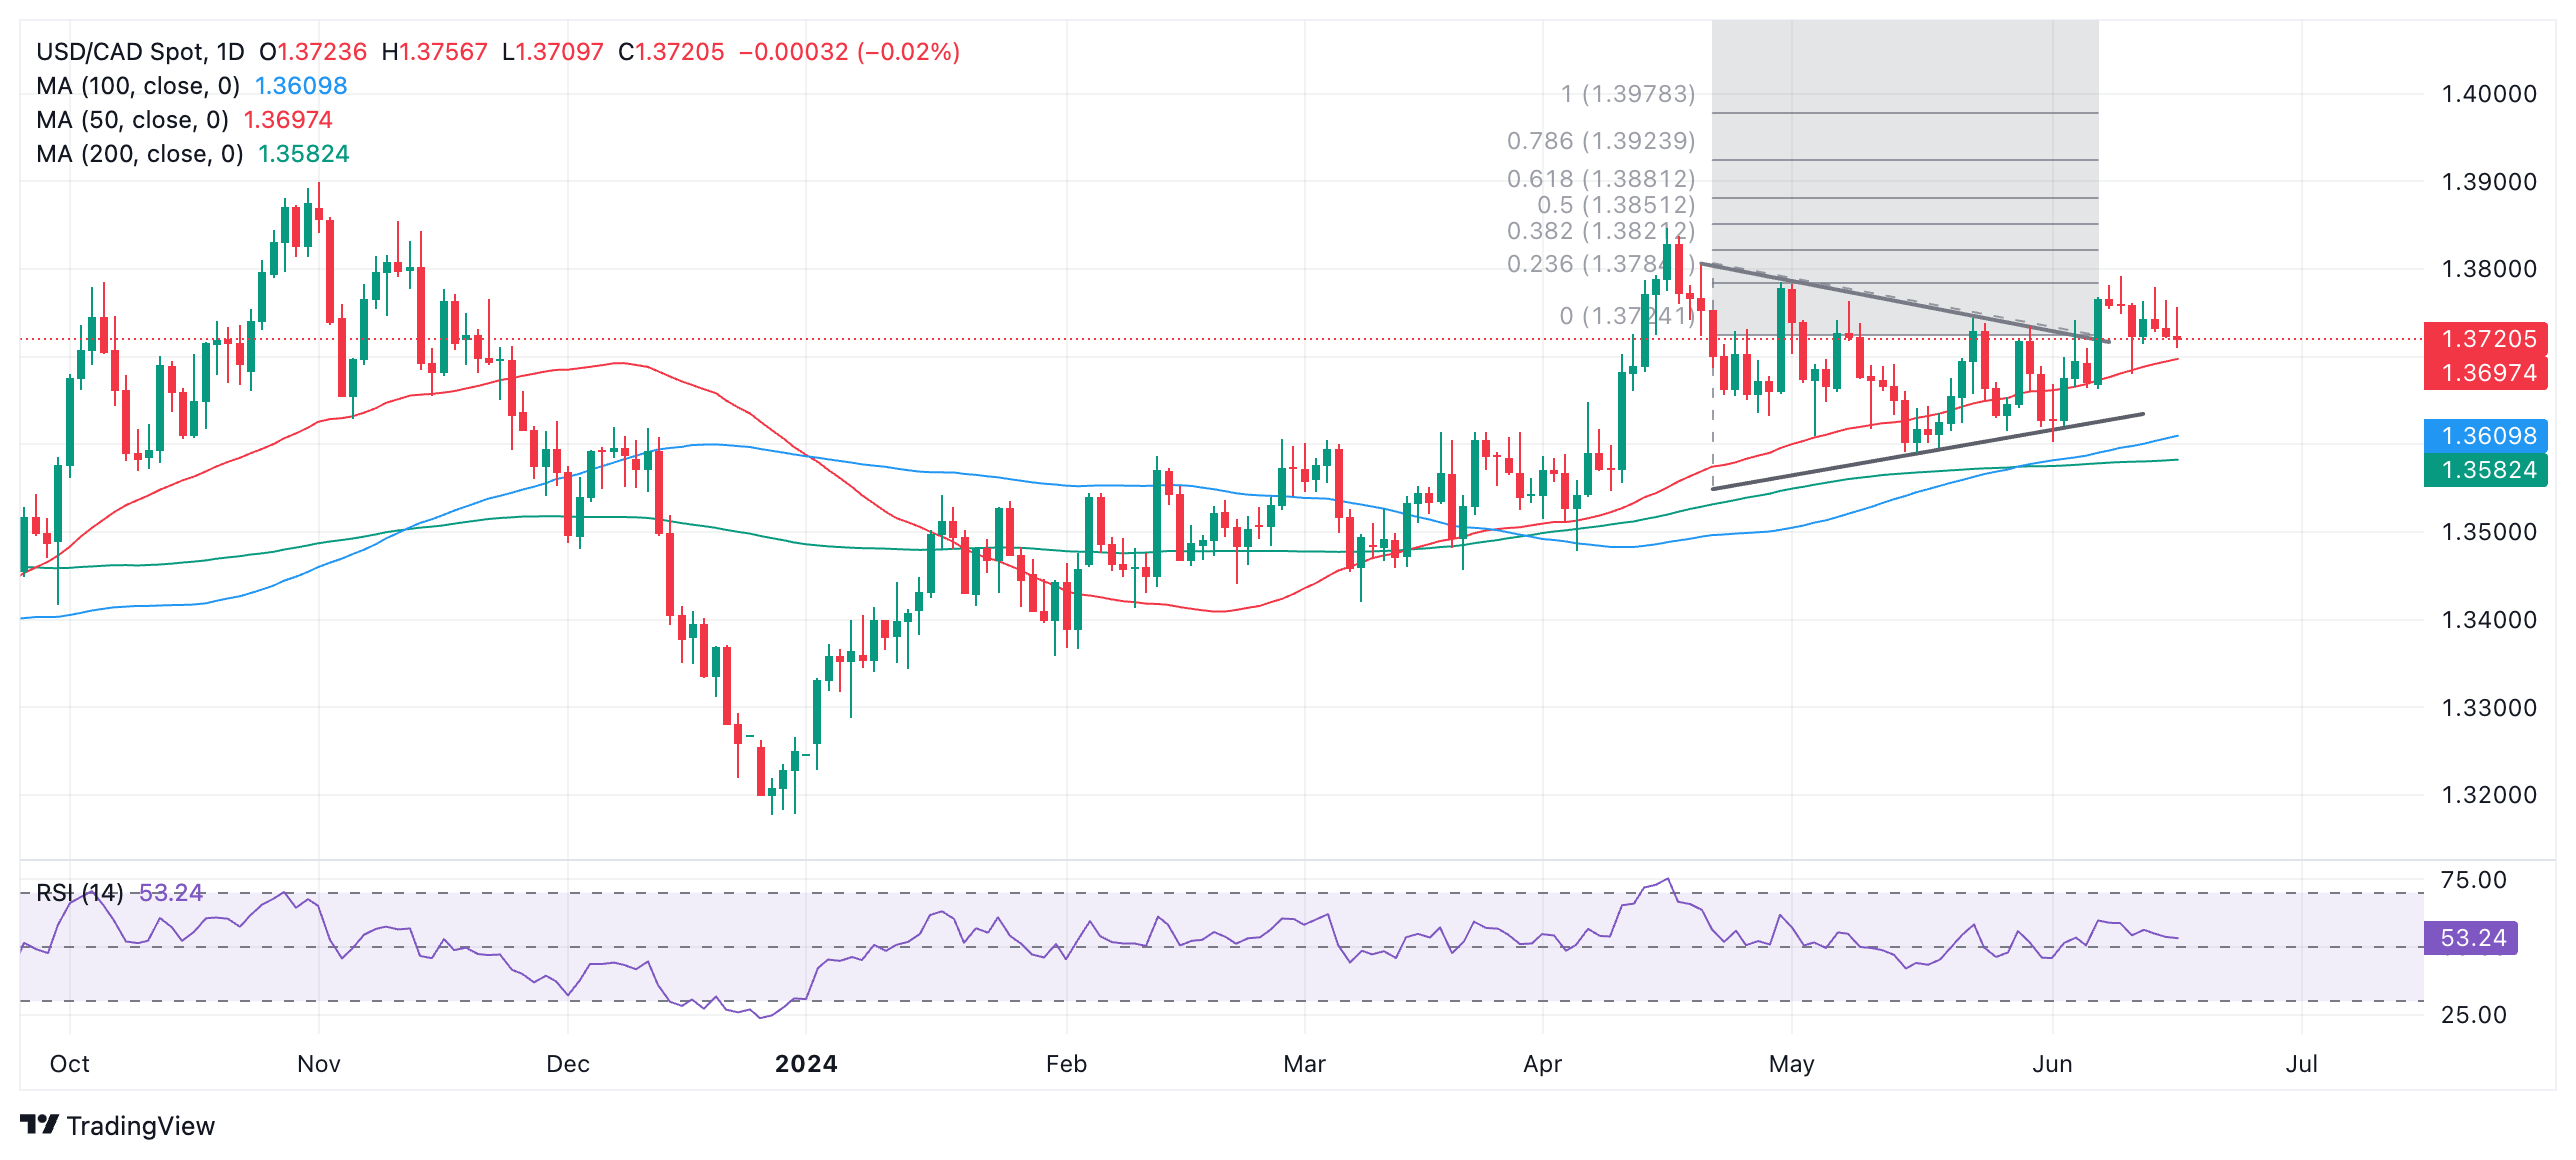
- USD/CAD breaks out of a large symmetrical triangle price pattern, activating upside targets.
- Though it has backed and filled since the break, the probabilities favor a continuation higher.
- A break above the June 11 high would provide additional bullish confirmation.
USD/CAD has decisively broken above the upper borderline of a large Symmetrical Triangle price pattern on the daily price chart.
USD/CAD Daily Chart
The long green bullish candle that formed on June 7 and accompanied the upside breakout from the Triangle qualifies as the decisive break and activates the bullish targets for the pattern. The conservative target for the pattern lies at 1.3881, the 0.618 Fibonacci extrapolation of the height of the Triangle from the breakout point higher.
A more bullish target lies at 1.3978, the 100% extrapolation of the height of the triangle northwards.
Although price action has been slightly bearish since the June 7 breakout, the odds favor a resumption of the initial move higher. A break above 1.3791 (June 11 high) would provide further bullish confirmation.
A decisive breakdown from the triangle would reverse the trend and suggest a move down to an initial target at roughly 1.3472.
